I recently spoke at a Continuing Legal Education Program for Texas real estate attorneys about regulation of hydraulic fracturing. My job was to give a short overview of the development of fracing and horizontal drilling in the US and its impact on production and the economy. Here are some slides I used in the presentation.
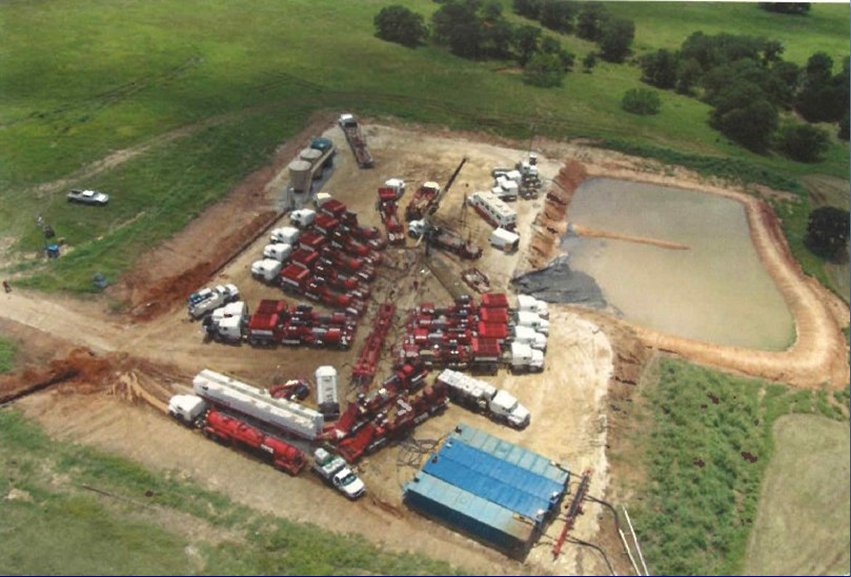
Below is a photo of a well during the process of fracing. The trucks are big hydraulic pumps, all hooked up to a manifold that is hooked to the well. The earthen tank in the picture is filled with fresh water used in the fracing operation. The water is mixed with sand and chemicals and pumped into the well under high pressure to “frac” the formation. Note that these pad sites are larger than for conventionally drilled wells. One pad site may be used to drill three or six or more wells. The horizontal lateral of the well will be 5,000-8,000 feet.
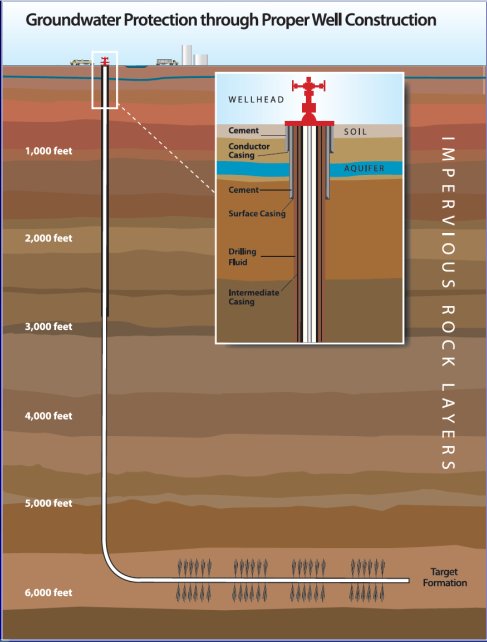
Below is a schematic for a horizontal well, intended to show the distance horizontally between fresh water aquifers and the depth at which the well is completed, and the multiple layers of casing installed between the well and the aquifer to protect fresh water. The distance between fresh water zones and the producing formations varies by field. For the Barnett Shale, fresh water is at about 1,200 feet, and the Barnett Shale is it about 6,500-8,000 feet. For the Haynesville Shale in Lousiana and East Texas, fresh water is at about 400 feet and the formation is at 10,500 to 13,500 feet. For the Marcellus Shale in Pennsylvanie, freshwater is at about 850 feet, and the formation is between 4,500 and 8,500 feet. Here is a video from Chesapeake showing how wells are drilled horizontally.
Horizontal wells are frac’ed in “stages.” Segments of the horizontal leg of the well are isolated, holes are punctured or “shot” through the well casing, and frac water is pumped into that segment of we well, through the perforations in the casing, and into the formation, fracturing the rock to allow oil and gas to escape into the wellbore. The pressure is then released, the frac water flows back up the hole, and the process is repeated for a different segment. Wells may be shot in 12 or more stages. Here is a video showing how the process works, created by Chesapeake.
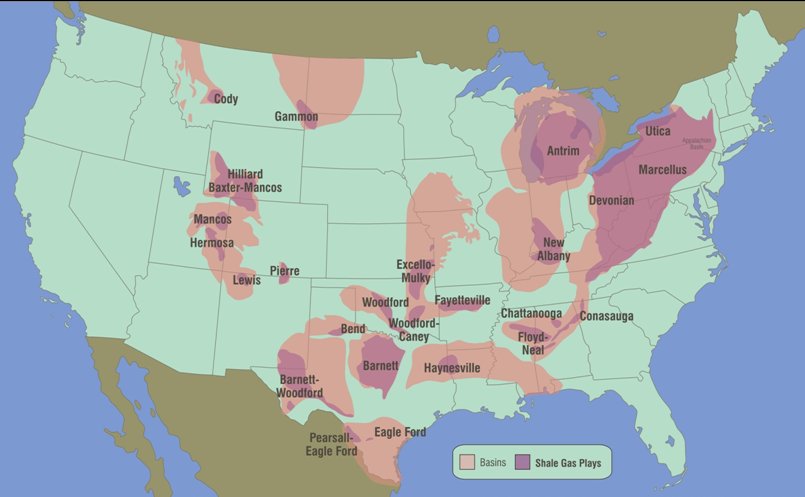
Below is a map showing the major shale plays in the US. Additional unconventional shale plays are being discovered and developed.
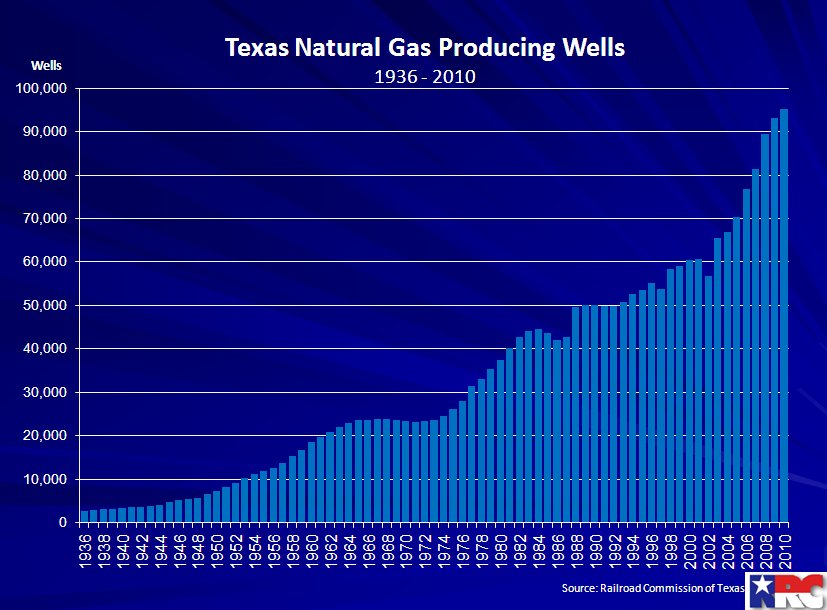
Below is a graph showing the number of gas wells producing in Texas over time. The number of wells increased significantly beginning in 2003, when shale drilling took off, and is approaching 100,000 wells.
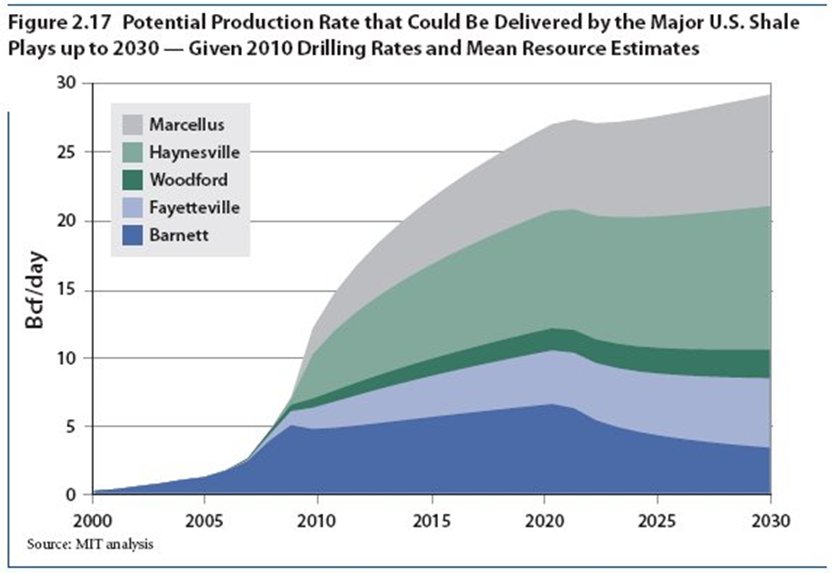
The graph below shows the potential for gas production from major shale plays according to a study by MIT.
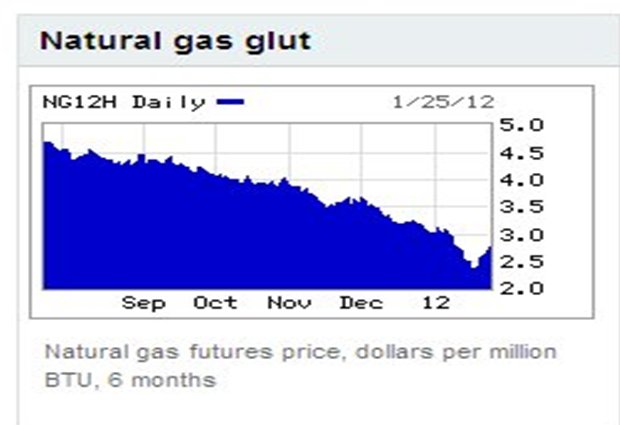
As gas production in the US increased, prices predictably declined. The result has been huge savings for US consumers, both residential and commercial. It has not been good news for the coal, nuclear and wind energy industries, which have to compete for natural gas as fuel for electric generation.
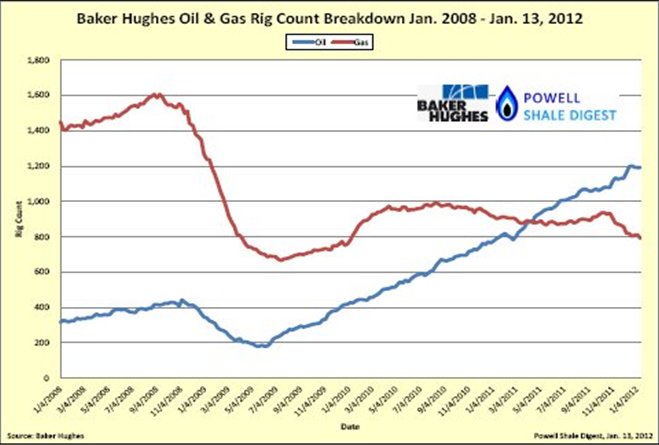
Another result of the gas glut is that exploration companies have moved to shale plays that produce oil and other liquid petroleum constituents, as shown by the graph below.
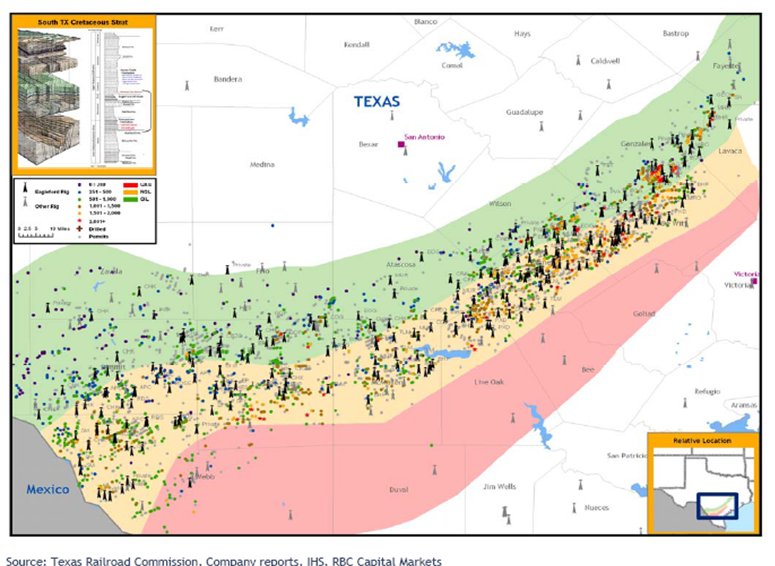
One of the largest oil shale plays is the Eagle Ford in South Texas, which has commenced development only in the last couple of years. There are now some 4,000 wells producing from the Eagle Ford formation. To date, those wells have produced 37 million barrels of oil and 311 billion cubic feet of gas. (Oil wells in the Eagle Ford also produce gas, thereby adding to the gas glut and holding gas prices down.) There are 250 rigs drilling in the Eagle Ford, and there are predictions that the field will be producing 900,000 bbls/day by the end of 2012, with reserve estimates of an average of 500,000 BOE per well.
Below is a map of the Eagle Ford. The formation dips (gets deeper) from northwest to southeast. The three colors on the map represent the “oil window” on the northwest flank of the field, the “gas window” on the southeast flank, and the “liquids window” in the middle. To date, the best wells are in the liquids window, and produce both oil and gas.
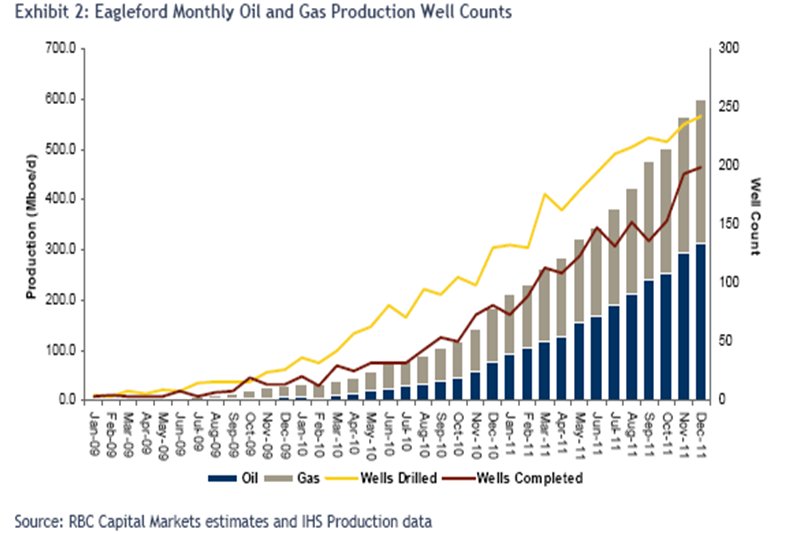
The graph below shows the increase in production from the Eagle Ford over the last 3 years, and the increased number of rigs in the field, over time.
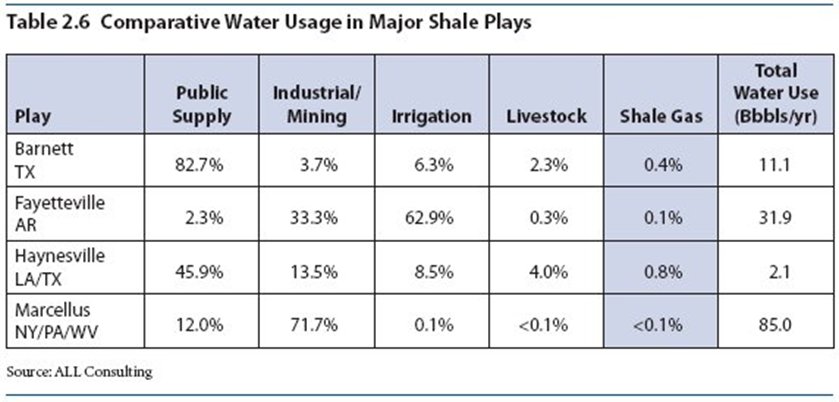
Fracing of wells uses a lot of fresh water — from 3 to 5 million gallons per well. But the industry points out that this water use is a small percentage of the total water used in the areas of the shale plays: