


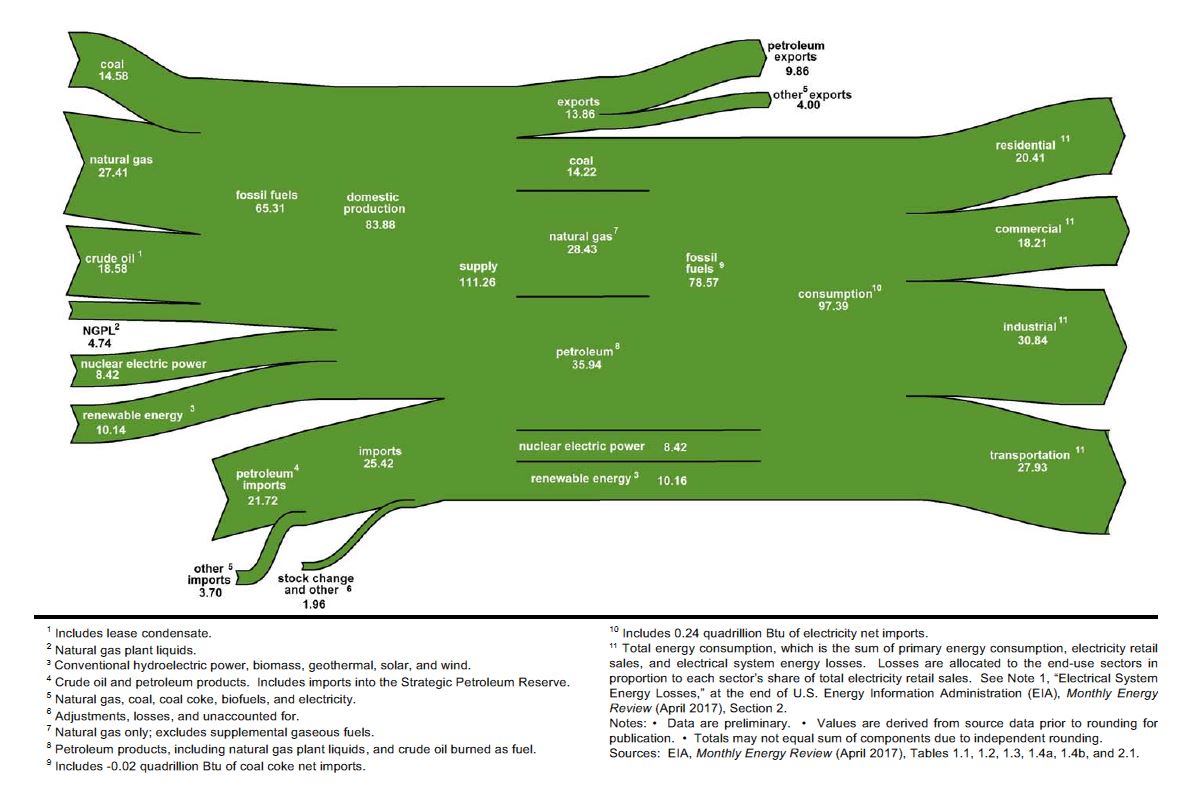
Here’s another great graph explaining US Energy production and consumption, from the Energy Information Administration. It’s called an Energy Flow Diagram. Numbers are in quadrillion BTU’s. Click on image to enlarge:
 Consider:
We still import 21.72 QBTU of petroleum, about 22% of our total consumption – about what we consume in residential uses. But we also export 13.86 QBTU.
Renewable energy – hydroelectric, biomass, geothermal, solar and wind – amount to about 10% of our total energy consumption. Nuclear 9%, Crude oil 19%, natural gas 28%, and coal 15%.
Here’s another:
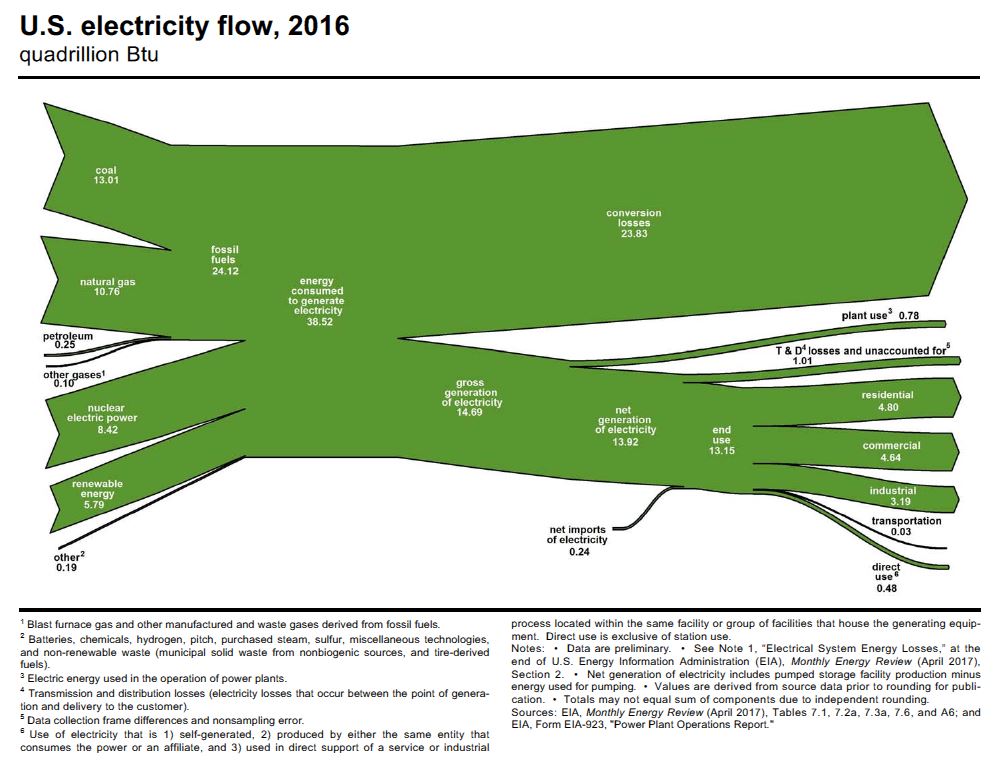 The most remarkable to me: we use 38.52 QBTU to generate electricity, but 23.83 QBTU of that is “conversion loss,” and only 13.15 QBTU of that energy actually is used as electricity. Ninety-three percent of coal consumption in the US is used to generate electric power. Electric power accounted for 100% of nuclear power consumption, 91% of coal consumption, and 55% of renewable energy consumption.
And here’s another:
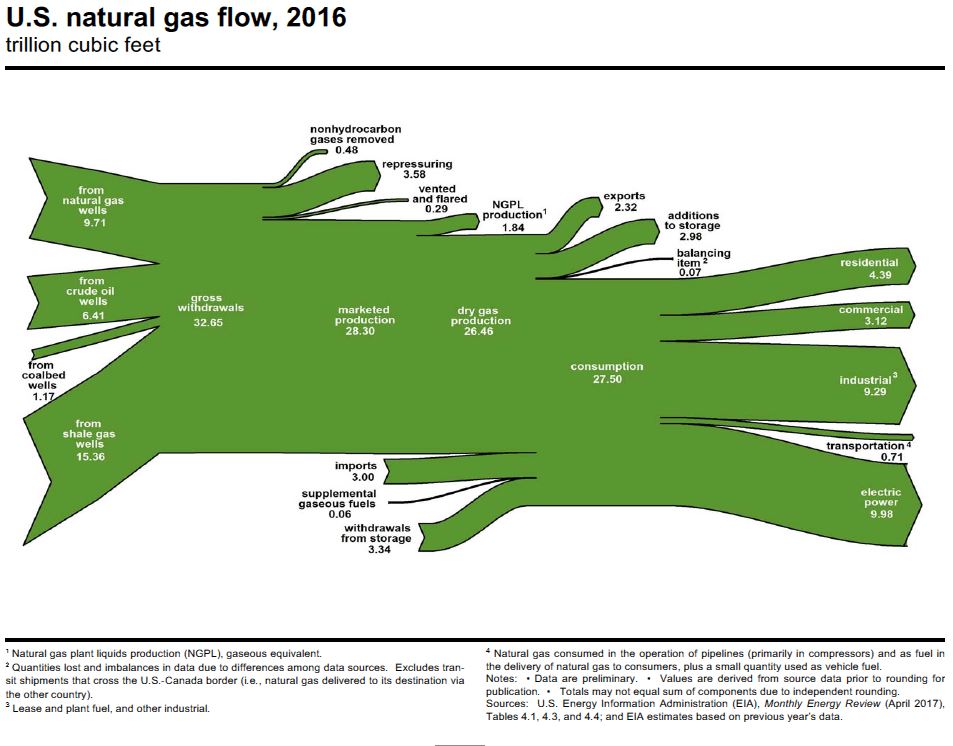
The US produced 15 trillion cubic feet of natural gas in 2016 from shale gas wells, 47% of total gas production. An unknown additional portion of shale gas production was from shale oil wells.