


Below is an interesting chart published by the U.S. Energy and Informaton Administration, showing how the U.S. used energy in the U.S. in 2007:
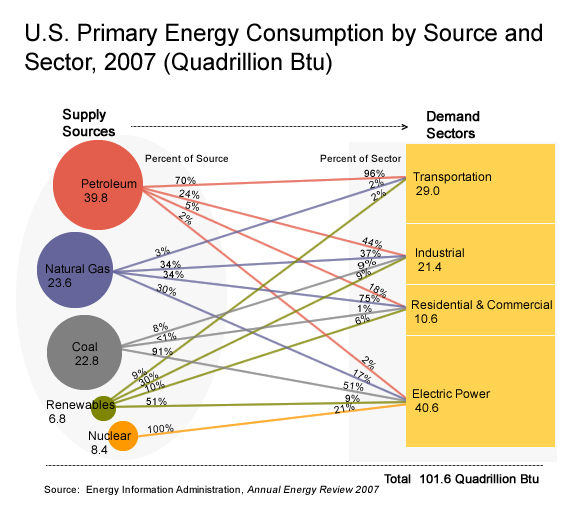
The sources of energy are on the left, the sectors of the economy that consume energy are on the right. The lines connecting supply sources and demand sectors show which sectors use which sources of energy. For example, petroleum represents 39.8% of the total supply of energy in the U.S. Seventy percent of that petroleum is used for transportation. Petroleum is the source of 96% of all sources of energy for the transportation sector. The transportation sector consumes 29% of all energy consumed in the U.S.
The chart reveals how natural gas is used in the U.S.: 34% in the industrial sector, 34% in the residential and commercial sector (as fuel to heat and cool homes and buildings), 30% to generate electricity. Most electricity is used by residential and commercial buildings, so in reality electricity is an intermediate demand sector. If it is eliminated as a demand sector, 61% of total demand would show as consumed by residential and commercial buildings. Natural gas would supply 14.8% of total energy used in residential and commercial buildings, either directly for heating and cooling or indirectly through its use to generate electricity.