As readers may know, I love graphs, and the Energy Information Administration is good at making them. Here are two particularly interesting ones.


As readers may know, I love graphs, and the Energy Information Administration is good at making them. Here are two particularly interesting ones.
One of the remarkable aspects of the oil and gas markets over the last few years has been the rapid decline of natural gas prices despite the continuing high price of crude oil. Historically, analysists have assumed that there is a relationship between the price of the two commodities. After all, both are basically sources of stored energy, which can be measured in British Thermal Units, or Btus. One barrel of crude oil has about the same energy as six million Btu of natural gas, so it has been assumed that one barrel of crude should have about the same value as six MMBtu of gas. When companies report their reserves, they often use the term BOE, or “barrels of oil equivalent,” meaning that they convert their gas reserves to oil barrels using this 6-to-1 ratio. But at today’s prices, the ratio on a Btu basis is closer to 12-to-1; it has been as low as 2.5-to-1 and as high as 19-to-1. So why is there now such a de-coupling of oil and gas prices?
I recently ran across a paper published by two MIT professors titled “The Weak Tie Between Natural Gas and Oil Prices,” by David J. Ramberg and John E. Parsons. You can find it here. The authors ask the question: Is there a relationship between the price of oil and the price of natural gas? If there was formerly such a relationship, has it been broken? They use historical data and analysis to answer these questions. Their conclusion:
despite large temporary deviations, natural gas prices continue to exhibit evidence of a cointegrating relationship with crude oil prices, and gas prices consistently return to a long-run relationship. However, this relationship has apparently shifted at least once over a 12-year period to a new equilibrium. There is no statistical evidence to support the claim that a relationship between the two price series has been completely severed.
The Energy Information Administration has issued its annual energy projections.
Highlights:
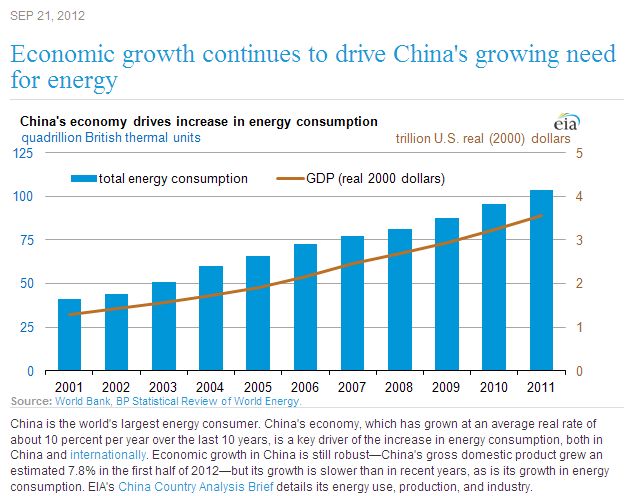
Domestic crude oil production is expected to grow by more than 20 percent over the coming decade: Domestic crude oil production increased from 5.1 million barrels per day in 2007 to 5.5 million barrels per day in 2010. Over the next 10 years, continued development of tight oil combined with the development of offshore Gulf of Mexico resources are projected to push domestic crude oil production to 6.7 million barrels per day in 2020, a level not seen since 1994.
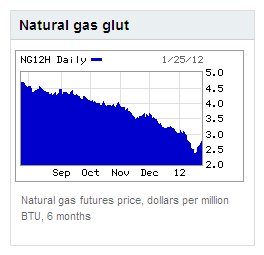
Natural gas prices are much in the news. Prices have fallen precipitously in the past few weeks. Natural gas futures have fallen 35% in the past year. Warm weather this winter has created a gas glut. In his state of the union address, President Obama said the US now has 100 years of natural gas supply and touted gas as the energy future. Analysts are predicting that prices will continue to fall. Predictions are that natural gas storage capacity will be tested this year.
http://www.usatoday.com/money/industries/energy/story/2012-01-16/low-natural-gas-prices/52592508/1
http://finance.yahoo.com/news/natural-gas-prices-fall-further-183315966.html
Two recent articles by a New York Times reporter, Ian Urbina, have caused strong reactions among the industry and those following shale plays in the U.S. Urbina’s articles may be found here and here. Urbina’s basic theme is that the new reserves of natural gas attributed to shale plays are not real, but are a “Ponzi scheme” created by overestimates of reserves by companies desiring to pump up their stock prices. Urbina bases his conclusions on emails from different industry players and analysts, including the Energy Information Administration, PNC Wealth Management and IHS Drilling Data, and anonymous sources in the industry, including Chesapeake and Enron. Links to these emails are in the articles. Many of them date back to 2009. “In the e-mails, energy executives, industry lawyers, state geologists and market analysts voice skepticism about lofty forecasts and question whether companies are intentionally, and even illegally, overstating the productivity of their wells and the size of their reserves. Many of these e-mails also suggest a view that is in stark contrast to more bullish public comments made by the industry, in much the same way that insiders have raised doubts about previous financial bubbles,” says Urbina.
Urbina’s articles have provoked strong responses.
Newfield Exploration has reported that it is drilling horizontal wells with “super extended laterals” in the Woodford Shale in Oklahoma — wells with laterals exceeding 5,000 feet. Newfield has so far drilled 14 super-extended lateral wells, with an average length of 9,000 feet. Those wells had an average gross initial production rate of approximately 9 MMcfe/day.
ConocoPhillips reported that it has completed the drilling of four horizontal wells in the Eagle Ford shale play, in its “liquids-rich” core. The first of these wells was put on production in March and flowed at an initial rate of 3.8 mmcf/day and 1,200 barrels/day of condensate.
All of the new shale gas production continues to put downward pressure on gas prices. Natural gas futures for June delivery fell 36.8 cents, or 8.5 percent on Thursday, April 29 on NYMEX. So far this year, natural gas futures have fallen 29 percent. The Energy Information Administration reported that the supply of gas in storage increased by 83 Bcf for the week ended April 30. Gas in storage is 315 Bcf above the 5-year average.
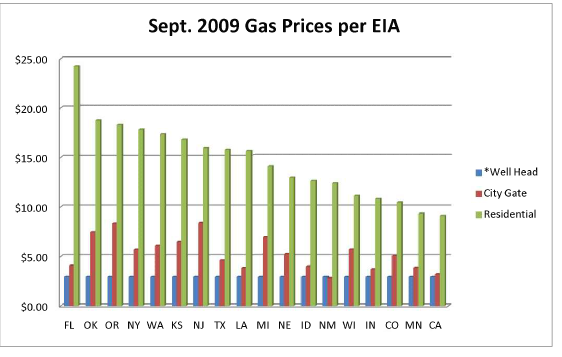
The information below is from the Energy Information Administration. Note the wide variation in City Gate and Wellhead Prices among different states:
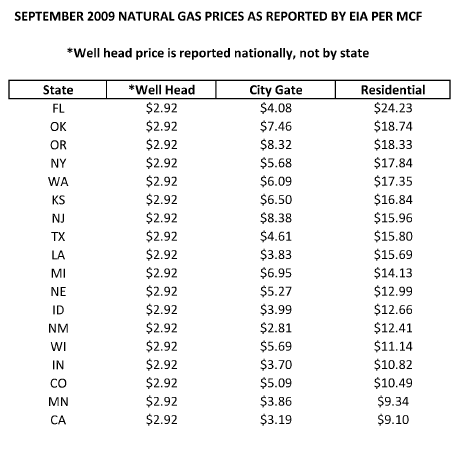
Below is the same information in graph form. Why would average residential gas prices in Texas be $12.88 per mcf, while residential prices in California and Minnesota — far from natural gas production — be less than $10 per mcf? Why such variations in Residential prices?
The International Energy Agency (IEA) issued a forecast of world energy consumption and use, and for the first time included a scenario projecting the impacts of taking steps to stabilize greenhouse gases in the atmosphere at about 450 parts per million by 2030. This “450 Secnario” would limit overall temperature increases to 2 degrees C., versus a rise in global temperature of as much as 6 degrees if no efforts to curb carbon dioxide are made. The report compares this 450 Scenario to its “reference scenario,” its projections of energy production, prices and consumption assuming no policy changes are enacted.
Its conclusions:
Under the reference scenario, oil prices would increase to $87/bbl in 2015, $100/bbl by 2020, and $115/bbl by 2030 (in 2008 dollars). Under the 450 Scenario, the oil price would level off at $90/bbl by 2020.
Momentum appears to be gaining to increase use of compressed natural gas in vehicles in the U.S., both to decrease the nation’s dependence on foreign oil and as a “bridge fuel” to fight global warming.
Boone Pickens’ efforts to promote natural gas as an alternative to gasoline in vehicles seems to be gaining momentum. In a column published by the Huffington Post, Pickens said that the recent advances in extraction of natural gas from shales is a “game-changer.” “One study estimates that we have enough natural gas to satisfy current demand for the next century.” Pickens reports that H.R. 1835, the NAT GAS Act, has strong bipartisan support in Congress. the NAT GAS Act provides incentives for installation of compressed natural gas (CNG) fueling stations and use of CNG in large trucks and fleet vehicles.
Natural gas gives off 25% less carbon dioxide than oil for the same amount of energy produced. About 1/3 of total U.S. carbon dioxide emissions come from burning of gasoline in internal combustion engines. For a good summary of the use of CNG, go to the U.S. Department of Energy’s website on Energy Efficiency and Renewable Energy.
Although Texas leads the nation in natural gas production, it is behind ten other states in the number of CNG fueling stations.