Articles Posted in Energy Policy

Published on:

Twenty-two U.S. House Democrats from Texas, Louisiana, Oklahoma, New Mexico, Arkansas, Utah and Idaho delivered a letter to Environmental Protection Agency Director Lisa P. Jackson, cautioning the EPA to do a “reasonable and transparent study” of whether hydraulic fracturing of wells creates risks to drinking water. EPA is required to study whether hydraulic fracturing creates risks to underground sources of drinking water under the 2010 Appropriations Act for the Department of the Interior. The producing-states Congressmen want to be sure that the EPA’s study is scientific, systematic, transparent, accurate and valid.

The EPA conducted a similar study of fracing in 2004. That study was done to investigate whether hydraulic fracturing of wells completed in coalbed methane seams posed a risk to groundwater drinking supplies. The study was in response to alleged incidents of groundwater contamination and to a judgment of a U.S. Court that, because hydraulic fracturing of coalbeds to produce methane is a form of underground injection, the EPA is required to regulate it under Part C of the Safe Drinking Water Act. That Act requires states to regulate underground injection of fluids and to develop an Underground Injection Control Program approved by the EPA. The EPA’s 2004 study of fracturing of coalbed methane wells found no evidence that any water had been contaminated by fracing of wells or that fracing posed any risk to drinking water. That study was criticized by some, including scientists in the EPA. In 2005, Congress exempted hydraulic fracturing from coverage under the Safe Drinking Water Act, in part at least based on EPA’s 2004 study.

The requirement for a new EPA study of fracing in 2010 has been driven, in my opinion, by the development of the Marcellus Shale play in Pennsylvania and New York. New York has placed a moratorium on permits for wells and has published its own draft study of risks to surface and underground water supplies caused by drilling in the area of upstate New York that provides drinking water to New York City. That study is still subject to comment and revision and has caused much controversy in New York. The New York draft study likewise concludes that hydraulic fracturing poses no risk to drinking water if properly regulated. In a related development, a bill in Congress, the FRAC Act, proposes to require companies to disclose the chemical content of frac fluids.

Published on:

The International Energy Agency (IEA) issued a forecast of world energy consumption and use, and for the first time included a scenario projecting the impacts of taking steps to stabilize greenhouse gases in the atmosphere at about 450 parts per million by 2030. This “450 Secnario” would limit overall temperature increases to 2 degrees C., versus a rise in global temperature of as much as 6 degrees if no efforts to curb carbon dioxide are made. The report compares this 450 Scenario to its “reference scenario,” its projections of energy production, prices and consumption assuming no policy changes are enacted.

Its conclusions:

Under the reference scenario, oil prices would increase to $87/bbl in 2015, $100/bbl by 2020, and $115/bbl by 2030 (in 2008 dollars). Under the 450 Scenario, the oil price would level off at $90/bbl by 2020.

Published on:

The Energy Information Administration has issued rankings of states in production of oil, gas, coal, electricity generation, and energy consumption. Texas ranks prominently in most categories.

— Texas is first in total energy production, producing 10,997 trillion Btus of energy in 2006 (the most recent information available). Wyoming is second (mainly from coal production) with 10,062 trillion Btus. Texas produced 15.5% of all the energy produced in the nation.

— Texas is first in crude oil production, producing 32.77 million barrels in May 2009 (20% of the nation’s production), ahead of Alaska with 21 million barrels; and (by far) first in natural gas production, producing 6 trillion mcf in May 2009 (30% of the nation’s production), ahead of second-place Wyoming with 1.9 trillion mcf.

Published on:

America’s Natural Gas Alliance, a recently formed energy lobbying group formed by natural gas producers, has issued a press release praising the Senate’s version of a climate bill.  Without actually endorsing the bill, the Alliance commended the bill’s authors for “including provisions in their bill that will enable us to continue to engage in the process of developing language that will effectively promote natural gas as part of the climate solution.”

The Alliance was formed in March 2009, and according to its website it represents 28 of North America’s largest independent natural gas producing companies, whose members produce more than 40 percent of total U.S. natural gas supplies, about nine trillion cubic feet per year. Its members include Anadarko, Apache, Chesapeake, Devon, El Paso, Encana, Petrohawk, Pioneer, Plains, and XTO. The Alliance’s position on the Kerry-Boxer energy bill is markedly different from that of the American Petroleum Institute and the Texas Alliance of Energy Producers, long-time lobbyists for the energy industry which have come out strongly against cap-and-trade legislation. Alex Mills, President of Texas Alliance of Energy Producers, is in particular an opponent of cap-and-trade, saying that it will wreak havoc on the energy industry. Chesapeake, Devon, Encana, and XTO are also members of the Texas Alliance. Politics makes strange bedfellows.

But companies relying mainly on gas production — more than 90 percent of Chesapeake’s total production is natural gas — believe that natural gas producers can benefit from climate legislation, since natural gas is a clean-burning fuel with much lower carbon emissions per unit of energy than oil or coal. Tom Price, Senior V.P. of Chesapeake for corporate development and government relations, said that “We think Texas, Oklahoma, Louisiana, Arkansas and the states that are primarily natural gas producers will come out very favoarable to a legislation that differentiates among the low-carbon fuels.”

Published on:

Items from this week:

Prices:  Natural gas prices continue to decline. Below is a comparison of gas NYMEX futures prices with S&P 500 for the last year:

Gas Price Chart.JPG


On August 14, futures for September delivery settled at $3.24/MMBtu, a 52-week low.  Futures prices have declined about 65% from this time a year ago. The Energy Information Administration reports that gas in storage increased by 63 Bcf to 3.152 Tcf for the week ended August 7, compared to 2.65 Tcf a year ago, and well above the five-year average of 2.635 Bcf. Absent severe supply disruptions or a very cold winter, gas prices are likely to remain low for some time.


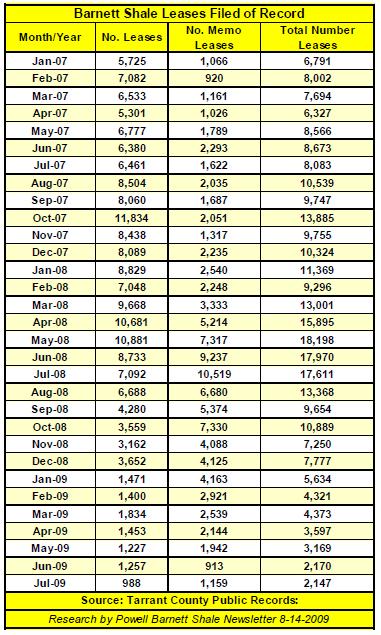
The price decline has resulted in a corresponding decline in lease and drilling activity. The chart below shows the number of oil and gas leases filed of record in Tarrant County, the center of Barnett Shale activity:

Barnett Shale Leases.JPG

This shows a decline in leasing from 18,000 leases in May, 2008, the height of the leasing frenzy, to 2,000 in July 2009.


Earthquakes:  Scientists from Southern Methodist University have tentatively concluded that recent earthquakes in the vicinity of Dallas-Fort Worth Airport may have been caused by a salt water disposal well located at the southern end of the airport, operated by Chesapeake.


Continue reading →

Published on:

The NAT Gas Act has been introduced in the U.S. Senate, as S. 1408, sponsored by Senators Robert Menendez, D-NJ, and Orrin Hatch, R-UT. The Act provides incentives for increased use of vehicles powered by natural gas. It was previously introduced in the House as H.R. 1835. The Act increases the tax credit for purchasing natural gas vehicles and provides incentives for installation of natural gas fueling stations.

Freightliner, a large truck maker, announced its first natural gas-powered truck model. The company claims that the truck will save $6,000 per year in fuel and maintenance costs.

Clean Energy Fuels Corporation last week opened what it says is the world’s largest natural gas truck fueling station, in the Ports of Los Angeles and Long Beach, California.

Published on:

On April 2, Keith O. Rattie, CEO of Questar Corporation, gave a speech to students at Utah Valley University about global warming and U.S. energy policy.  The parts of the speech about global warming seek to raise questions about the science behind conclusions of the global warming trend. The most interesting parts of the speech, to me, concern U.S. energy policy.

Points made by Mr. Rattie:

  •   The stated U.S. energy policy goal is for an 80 percent reduction in CO2 emissions by 2050 – “80 by 50.” Rattie says that this goal is unattainable. According to him, the U.S. carbon footprint is about 20 tons per person per year. An 80 percent reduction would require that footprint to be reduced to 4 tons per person per year by 2050. But that does not take into account population growth. If projections for population increases in the U.S. are taken into account, 80-by-50 would require that the U.S. reduce its carbon emissions to 2 tons per person per year – a 90 percent reduction in per capita carbon footprint.

Continue reading →

Published on:

Momentum appears to be gaining to increase use of compressed natural gas in vehicles in the U.S., both to decrease the nation’s dependence on foreign oil and as a “bridge fuel” to fight global warming.

  • Last Week, the Potential Gas Committee issued a report estimating that the toal U.S. natural gas resource base at year-end 2008 was 1,836 trillion cubic feet, an increase of 39% from its 2006 estimate. Most of this increase comes from newly discovered shale reservoirs. Boone Pickens said that the new estimate “is the equivalent of nearly 350 billion barrels of oil, about the same as Saudi Arabia’s oil reserves.”
  • Boone Pickens’ energy plan includes greatly expanding the use of natural gas as fuel for transportation.
Published on:

Four legislators from Colorado, New York and Pennsylvania have introduced a bill making hydraulic fracturing subject to regulation by the Environmental Protection Agency under the Safe Water Drinking Act.  Dubbed the Fracturing Responsibility and Awareness of Chemicals Act, or FRAC Act (
FRAC Act.pdf), the bill would amend the Safe Drinking Water Act to require companies to disclose the chemicals they use in their fracturing processes. The press release (
Press Release FRAC Act.pdf) from the legislators states that “It’s time to fix an unfortunate chapter in the Bush administration’s energy policy and close the ‘Halliburton loophole’ that has enabled energy companies to pump enormous amounts of toxins, such as benzene and toluene, into the ground that then jeopardize the quality of our drinking water.” (Benzene and toluene are not additives to frac fluid.)

An energy lobbying group, Energy in Depth, has denounced the bill as an “unnecessary financial burden” on the industry which could result in more than half of U.S. oil wells and one-third of gas wells being closed, and reduction in natural gas production of up to 245 billion cubic feet per year.


Continue reading →

Published on:

Last week I attended an Energy Syposium sponsored by South Texas Money Management, Ltd. in San Antonio. One of the speakers was Amy Myers Jaffe, who is the Wallace S. Wilson Fellow in Energy Studies at the James A. Baker III Institute for Public Policy at Rice University and associate director of the Rice University Energy Program. Ms. Jaffe is co-author of ”
U.S. Energy Policy FAQ- The U.S. Energy Mix, National Security and the Myths of Energy Independence.pdf” published by the Institute in 2008. A good read. Excerpts:

  • “The United States consumes about 20.6 million barrels per day (b/d) of oil, or roughly 25 percent of global demand. By comparison, China is the second largest consumer of oil at 7.2 million b/d and Japan the third at 5.2 million b/d. Russia and Germany are fourth and fifth, respectively, at 3.1 million b/d and 2.6 million b/d. India’s oil demand also is rising quickly, increasing by almost 40 percent since 1995 to the current average of about 2.5 million b/d. The most glaring differences in demand exist in the transportation sector. U.S. road pertoleum use represents 33 percent of all road petroleum use globally, which is twice as high in percentage terms as all of Europe. China, by contrast, currently represents 5 percent of all global road petroleum use.”


Continue reading →

Contact Information