


Peter Huddleston, President of Huddleston & Co. and a prominent petroleum engineer and a friend, agreed to report on the status of shale plays in Texas at our firm’s land and mineral owner seminar on November 9. He kindly agreed to let me use some of his slides. You can click on all images below to enlarge.
Peter’s presentation concentrated on developments in the Eagle Ford and the Permian Basin, by far the sources of most drilling in Texas today.
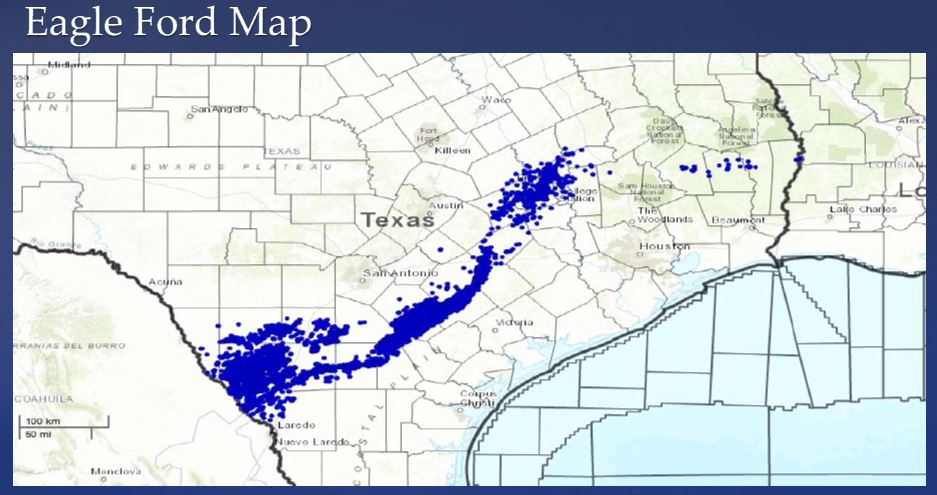
The map below shows the extent of the Eagle Ford formation.
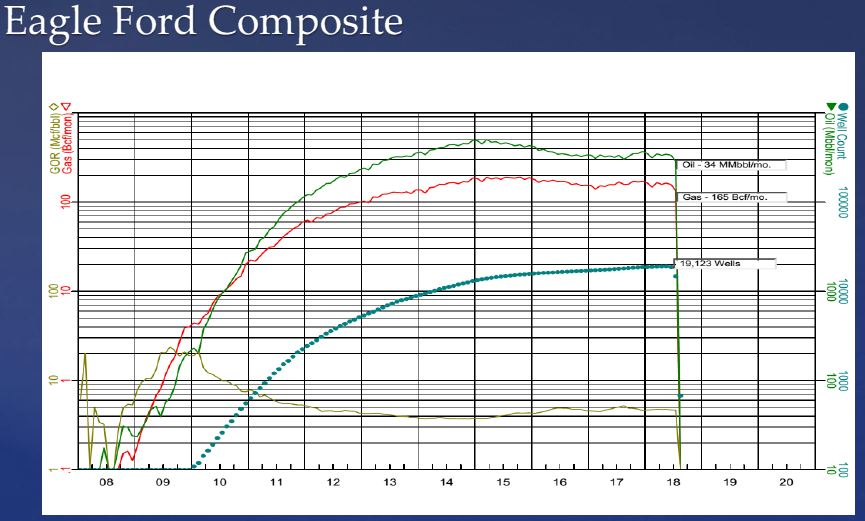
Below graph shows cumulative Eagle Ford production to date, and number of wells producing.
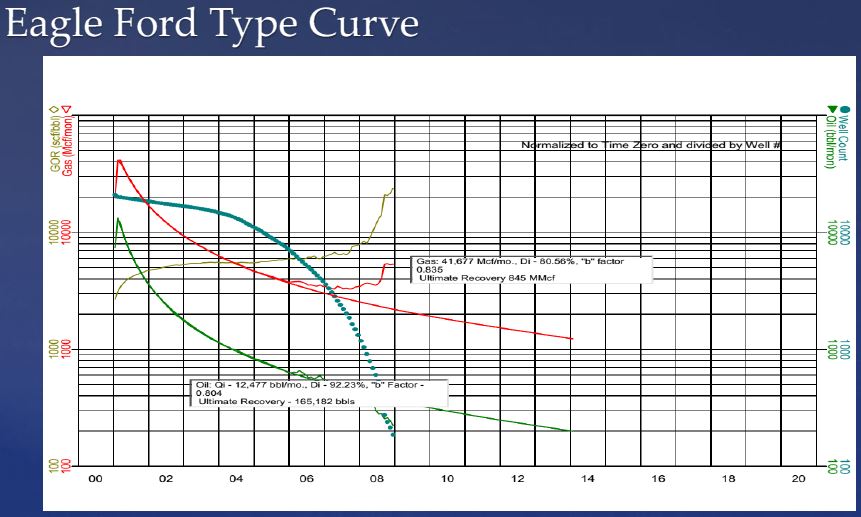
Below is Huddleston’s type curve for Eagle Ford wells – how a typical Eagle Ford well declines over time and estimated ultimate recovery – 185,000 barrels and 845 million cubic feet of gas.
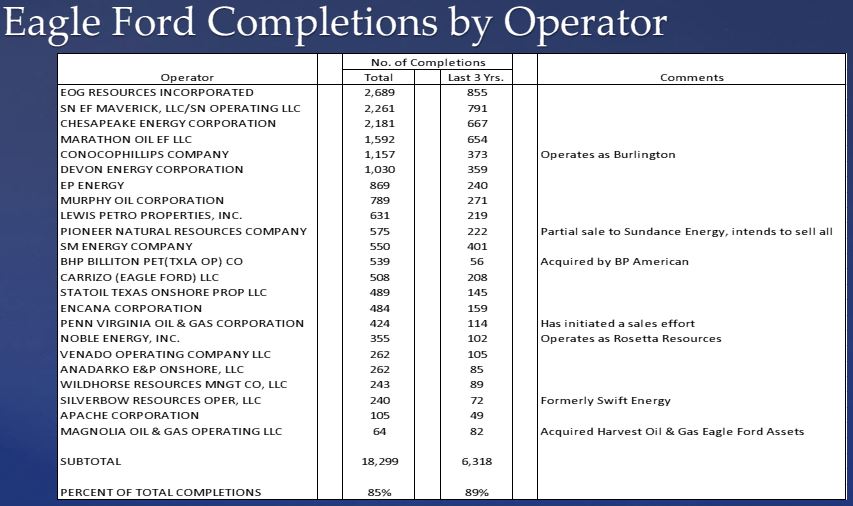
Most active operators in the Eagle Ford:
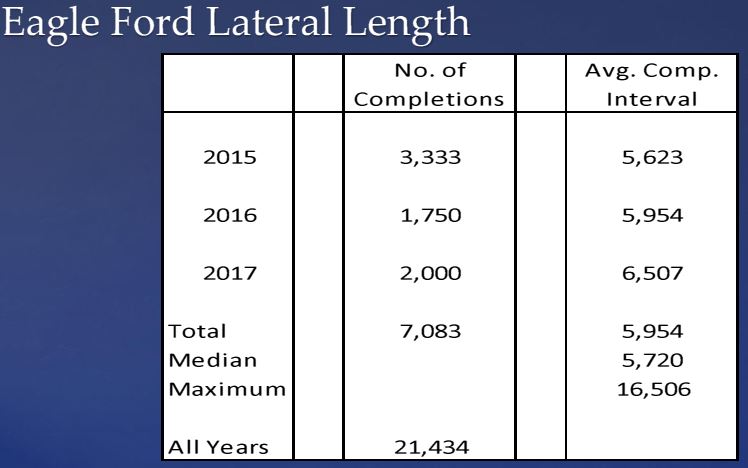
Huddleston’s study of changes in lateral length of wells over time:
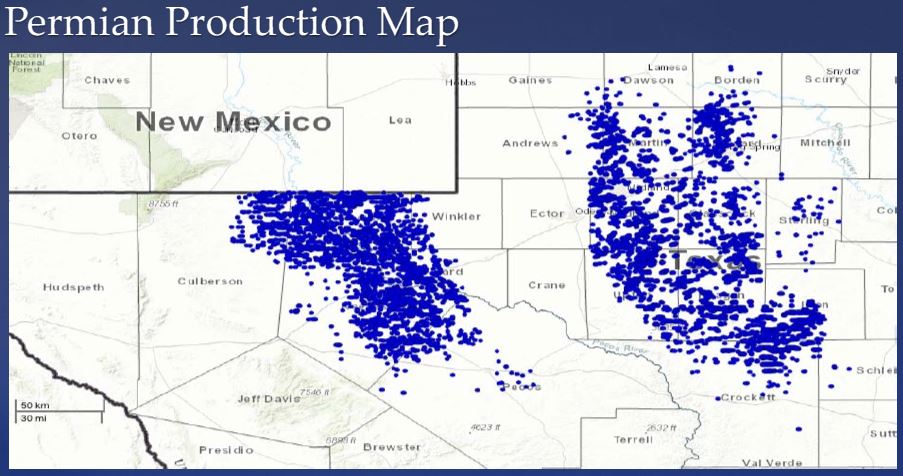
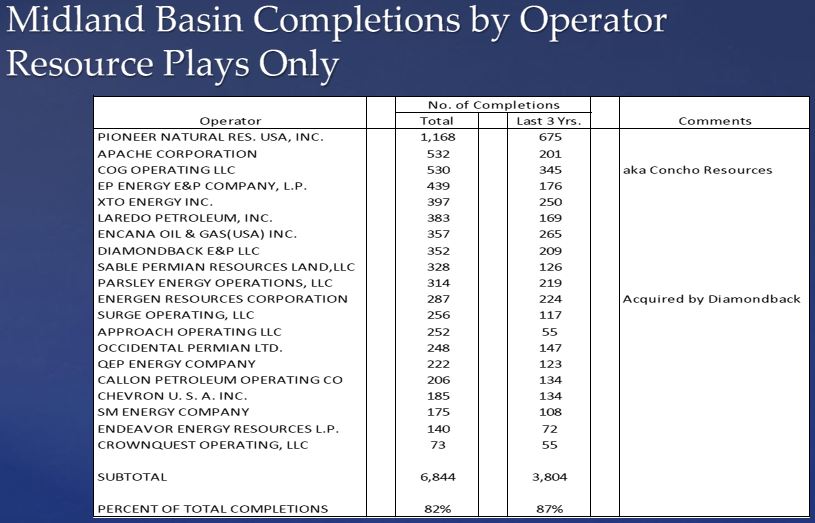
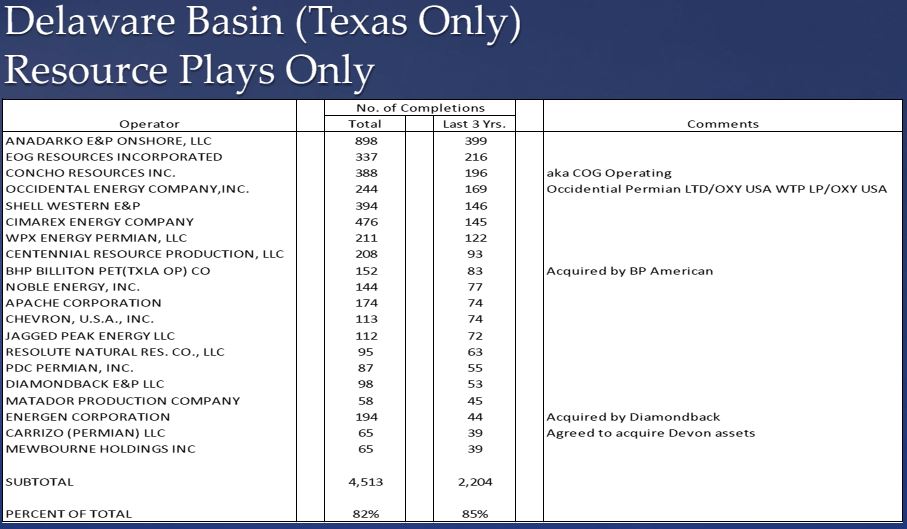
The Permian is divided between the Midland Basin on the west and the Delaware Basin on the east.
Production history for Midland Basin is below – still growing.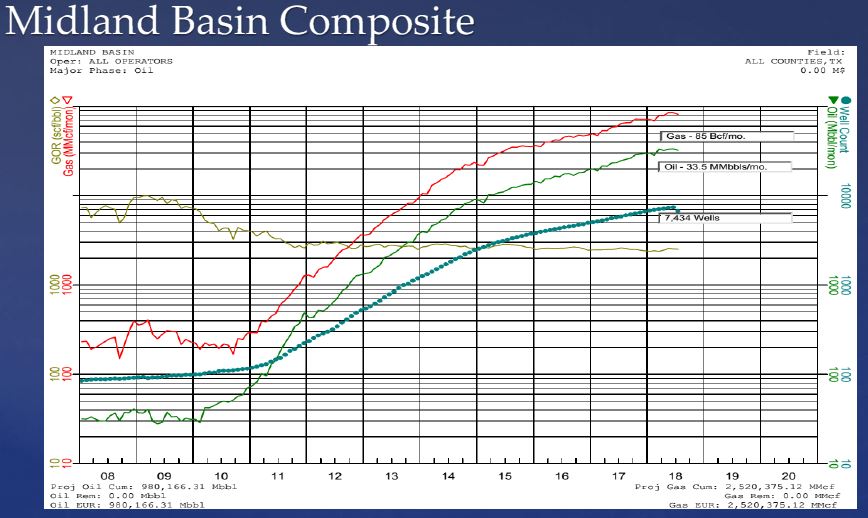
Production in the Delaware Basin is likewise continuing to increase.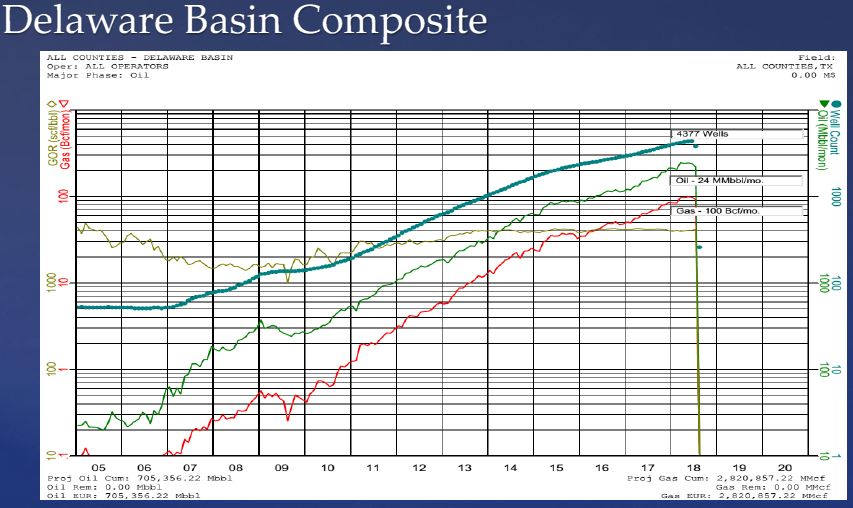
Huddleston’s type curves for Midland and Delaware Basin wells:
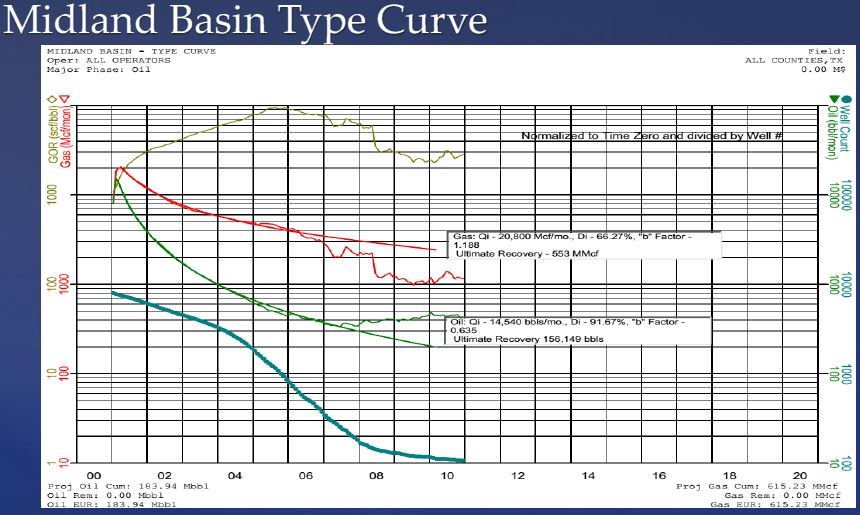
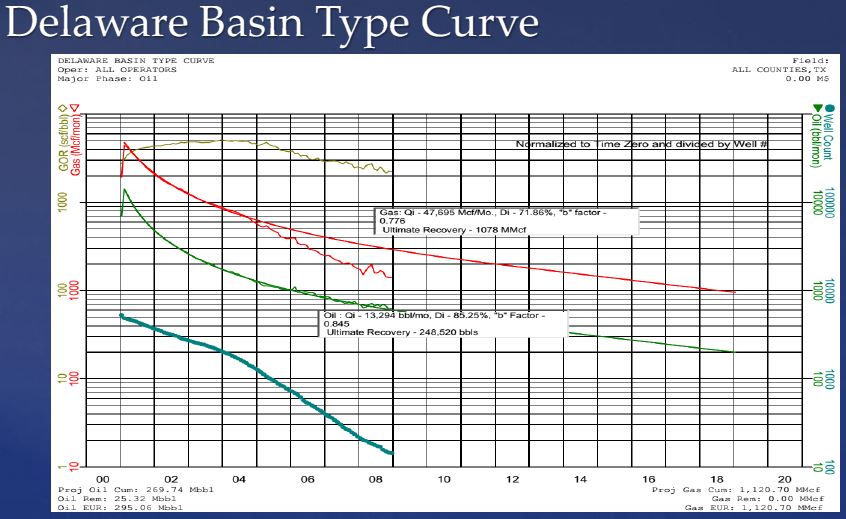
Note that Delaware Basin ultimate estimated recoveries are significantly better than Midland Basin.
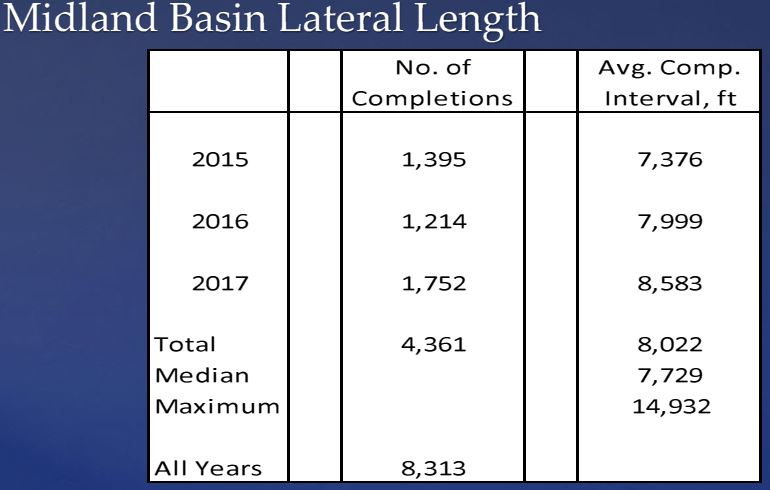
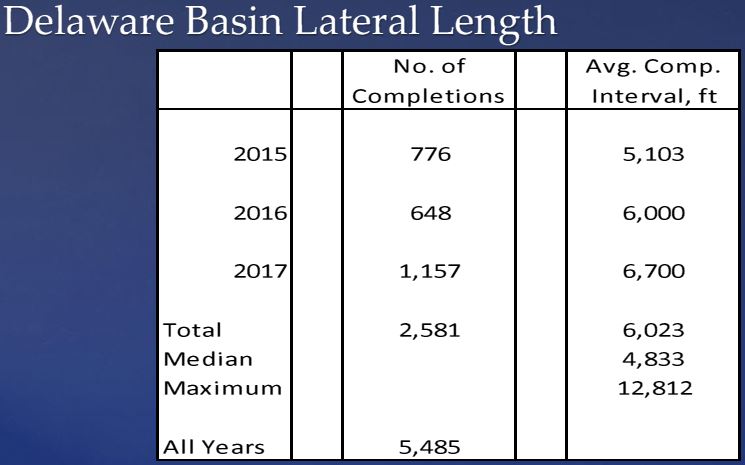
Increased lateral lengths over time in the two basins:
Most active operators:
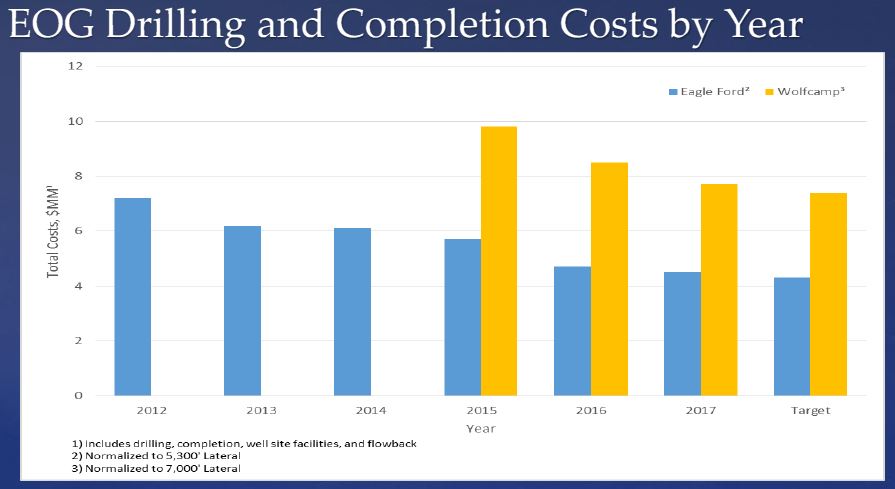
Peter also discussed how costs have decreased as drilling and completion techniques have improved. He presented the graph below of EOG’s costs as an example.
Many thanks to Peter for a great presentation.