Published on:

Below is an interesting chart published by the U.S. Energy and Informaton Administration, showing how the U.S. used energy in the U.S. in 2007:

U.S. Primary Energy consumption by source and sector 2007.jpg

The sources of energy are on the left, the sectors of the economy that consume energy are on the right. The lines connecting supply sources and demand sectors show which sectors use which sources of energy. For example, petroleum represents 39.8% of the total supply of energy in the U.S. Seventy percent of that petroleum is used for transportation. Petroleum is the source of 96% of all sources of energy for the transportation sector. The transportation sector consumes 29% of all energy consumed in the U.S.

The chart reveals how natural gas is used in the U.S.: 34% in the industrial sector, 34% in the residential and commercial sector (as fuel to heat and cool homes and buildings), 30% to generate electricity. Most electricity is used by residential and commercial buildings, so in reality electricity is an intermediate demand sector. If it is eliminated as a demand sector, 61% of total demand would show as consumed by residential and commercial buildings. Natural gas would supply 14.8% of total energy used in residential and commercial buildings, either directly for heating and cooling or indirectly through its use to generate electricity. 

Published on:

The Texas Railroad Commission has denied Chesapeake Energy’s request for permission to produce its Ramey 1H well in Tarrant County, because the well was drilled in violation of RRC spacing rules. Chesapeake drilled the horizontal well with a 3,553-foot lateral, even though its permit was for a lateral of only 1,839 feet. The RRC ordered Chesapeake to plug back the well so as to comply with the permit. The problem was that the wellbore passed wihin 330 feet of an unleased tract, violating the Barnett Shale field rules that require all wells to be located at least 330 feet from the boundary of the lease or unit. Kevin Cunningham, regional counsel for Chesapeake’s southern division, said that the ruling “would have the negative effect of rendering a significant amount of gas” unrecoverable under Chesapeake’s leases. For the story in the Fort Worth Star-Telegram, click here. Situations like those faced by Chesapeake will drive the debate for forced-pooling legislation in Texas.

Published on:

Congress passed the 2010 federal budget without adopting the Obama Administration’s proposal to eliminate several tax provisions favorable to the oil and gas industry, including percentage depletion and expensing of intangible drilling costs. See my earlier post discussing these tax provisions.  Adam Haynes, EVP of Texas Independent Producers and Royalty Owners Association (TIPRO), was quoted in TIPRO’s April 17 newsletter as saying that that the industry had “dodged a bullet,” and that repeal of these tax provisions, which purportedly cost taxpayers $80 billion a year, “would very negatively impact the exploration for needed energy here and throughout the nation.”

Published on:

The Energy Information Administration has revised its forecast for 2009 U.S. industrial natural gas demand, to decline by 7.4% this year. It predicts total natural gas consumption to fall 1.8% in 2009. U.S. natural gas production is expected to decline 0.3% in 2009, and to slip 1% in 2010. EIA predicts natural gas Henry Hub prices to average $4.24/mcf in 2009 and $5.83/mcf in 2010, compared with $9.13/mcf in 2008.

Chesapeake Energy has elected to further curtail its gas production, by a total of 400 mmcf in 2009, representing approximately 13% of Chesapeake’s production capacity.

One petroleum geologist and industry consultant, Arthur Berman, believes that the Haynesville Shale in Lousiana, touted as the hottest onshore gas play in North America, is overrated. His analysis of early discoveries shows that the wells decline rapidly, cost about $7.5 million per well to drill and complete, and would require a price of $8/mcf to break even.  http://petroleumtruthreport.blogspot.com 

Published on:

Range Resources announced on April 16 that it had completed a horizontal well in the Barnett Shale in southern Tarrant County that produced an average of 9.6 mmcf per day for the first 30 days of its production. This would be the largest Barnett Shale well completed to date. Range currently has three rigs drilling in the Barnett Shale.

Published on:

Seismic surveys have become the primary tool of exploration companies in the continental United States, both onshore and offshore.  3-D seismic surveys have lowered finding costs and allloowed exploration for reserves not locatable by other means, revolutionizing the industry.  Below is a non-scientific explanation of how seismic surveys work.

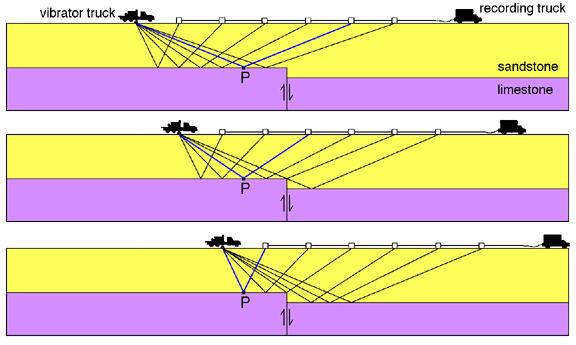
A seismic survey is conducted by creating a shock wave – a seismic wave – on the surface of the ground along a predetermined line, using an energy source. The seismic wave travels into the earth, is reflected by subsurface formations, and returns to the surface where it is recorded by receivers called geophones – similar to microphones. The seismic waves are created either by smalle xplosive charges set off in shallow holes (“shot holes“) or by large vehicles equipped with heave plates (“Veibroseis” trucks) that vibrate on the ground. By analyzing the time it takes for the seismic waves to reflect off of subsurface formations and return to the surface, a geophysicist can map subsurface formations and anomalies and predict where oil or gas may be trapped in sufficient quantities for exploration activities.

seismic truck

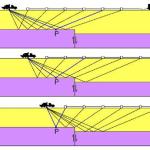
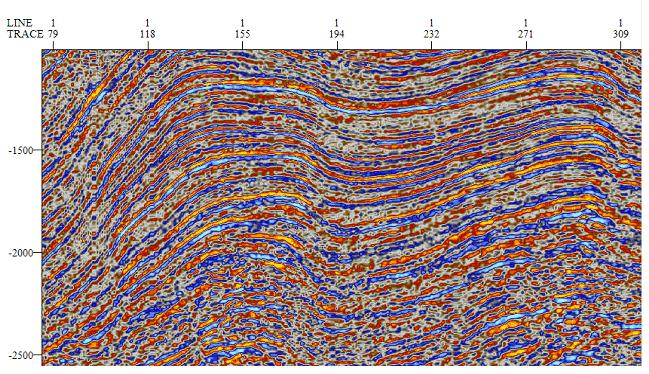
Until relatively recently, seismic surveys were conducted along a single line on the ground, and their analysis created a two-dimensional picture akin to a slice through the earth beneath that line, showing the subsurface geology along that line. This is referred to as two-dimensional or 2D seismic data.

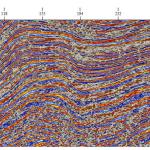
A 2D Seismic Line Image:

2D seismic


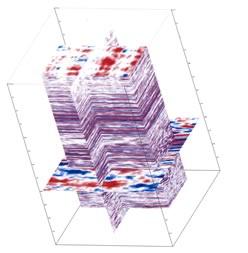
In the last 20-30 years, with the development of computers, geophysicists have been able to take seismic testing to a new level by conducting three-dimensional, or 3D, seismic tests. In 1980, about 100 3D surveys had been performed. By the mid 1990’s, 200 to 300 3-D surveys were being performed each year. In the 1980’s it took the most sophisticated Cray computers to analyze the data. Today, the analysis is performed on super-desk-top computers. Currently, almost all oil and gas exploratory wells are preceded by 3-D seismic surveys. The basic method of testing is the same as for 2D, but instead of a single line of energy source points and receiver points, the source points and receiver points are laid out in a grid across the property. The resulting recorded reflections received at each receiver point come from all directions, and sophisticated computer programs can analyze this data to create a three-dimensional image of the subsurface.
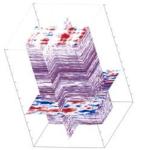
A 3D Seismic Image:

3D seismic

3D surveys can be conducted in almost any environment – in the ocean, in swamps, and in urban areas. A 3D seismic survey may cover many square miles of land and may cost $40,000 to $100,000 per square mile or more. The data obtained from such a survey is therefore very valuable, and if protected from disclosure constitutes a trade secret.  Seismic datea is licensed, bought and sold by seismic survey companies, brokers and exploration companies.

Continue reading →

Published on:

President Obama, in an attempt to recoup some of the money being spent to revive the economy, proposes to repeal several tax provisions near and dear to the oil and gas industry:

  • Enhanced oil recovery credit
  • Marginal well tax credit
  • Expensing of intangible drilling costs
  • Deduction for tertiary injectants
  • Passive loss exception for working interest owners in oil and gas properties
  • Manufacturing tax deduction for oil and gas companies
  • Percentage depletion deduction for oil and gas
  • Not surprisingly, the oil and gas industry is mounting a huge lobbying campaign to prevent loss of these tax benefits. 

The only one of these tax benefits that directly affects royalty owners is the percentage depletion deduction.  Currently, 15% of royalty income is deductible as “percentage depletion.”  The deduction is intended to recognize that the sale of oil and gas is in part the sale of a depleting asset, so that a portion of the royalty should be treated like a return of capital rather than as income.

Published on:

H.R. 1835, the New Alternative Transportation to Give Americans Solutions Act of 2009 (NAT GAS Act) was introduced in the U.S. House of Representatives by Dan Boren (D-OK), John Larson (D-CT) and John Sullivan (R-OK).  Its purpose is to promote the use of natural gas in vehicles, with an emphasis on large trucks and fleet vehicles.  It wiould provide incentives for installation of natural gas fueling stations.  It is the first legislation to promote Boon Pickens’ plan to use domestic natural gas to reduce dependence on foreign oil.

Published on:

Chesapeake Energy has obtained City approval for a “master drilling plan” that lays out plans to drill 69 horizontal wells from seven drilling locations within the City of Fort Worth.  The plan identifies the drilling locations and the gathering lines, and how produced water will be disposed of.  The plan shows how horizontal drilling technology has revolutionized the drilling of wells in shale formations. 
untitled.JPG


Published on:

In a previous post I discussed a recent Texas Supreme Court case, Exxon v. Emerald, reversing a multimillion-dollar judgment against Exxon for intentionally sabatoging wells so that they could not be re-entered. This nudged me to look at other royalty-owner related cases handed down by the Texas Supreme Court over the last ten years. The court’s record is not a good one for royalty owners. Highlights of the Court’s work:

HECI v. Neel (1998). HECI sued an adjacent operator for illegal production on an adjoining lease that damaged the common reservoir underlying both leases, and recovered a judgment for more than $3.7 million. HECI did not inform its royalty owners of the suit and did not share any of the judgment proceeds with the royalty owners. When HECI’s royalty owners found out about the suit, they sued HECI to recover their share of the judgment. The Supreme Court held that the royalty owners had waited too long to bring their suit, even though they did not find out about the suit until five years after the trial. The Court held that the royalty owners should have known that the adjacent operator was damaging the common reservoir by its operations.

Yzaguirre v. KCS Resources (2001). Plaintiffs were royalty owners who received royalties under a lease operated by KCS. KCS sold its gas under a 20-year contract with Tennessee Gas Pipeline, and the price under the Tennessee contract greatly exceeded the spot market price of the gas. But KCS paid royalties based on the “market value” of the gas, using comparable spot sale prices, well below the price it received from Tennessee. The Court held that KCS did not owe royalties based on the Tennessee price — and, it held that the Tennessee contract was not even competent evidence of the market value of the gas.

Contact Information