Articles Posted in Oil Price

Published on:

The Energy Information Administration appears to be at work during the government shutdown. Yesterday it released its regularly scheduled weekly reports.  Among them:

Crude-Futures-EIAYou can sign up for an email from EIA to receive a link to all of its reports at https://www.eia.gov/tools/emailupdates/?src=email .

Published on:

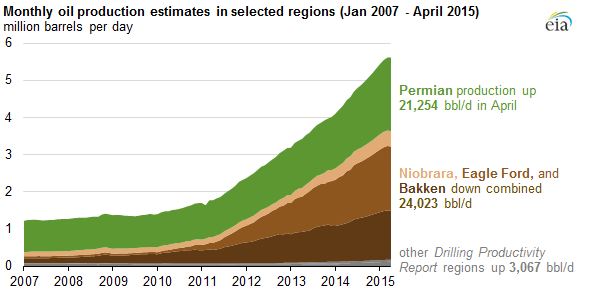
Here’s a great interactive graphic from Bloomberg, “Watch Five Years of Oil Drilling Collapse in Seconds,” that illustrates the relationship between oil price, rig count and U.S. oil production. The U.S. rig count has dropped from a high of 1930 in late 2014 to 502 last month. U.S. crude production continued to climb until mid-2015. Since then, it has dropped from 9.6 mmb/day to 9.2 mmb/day.

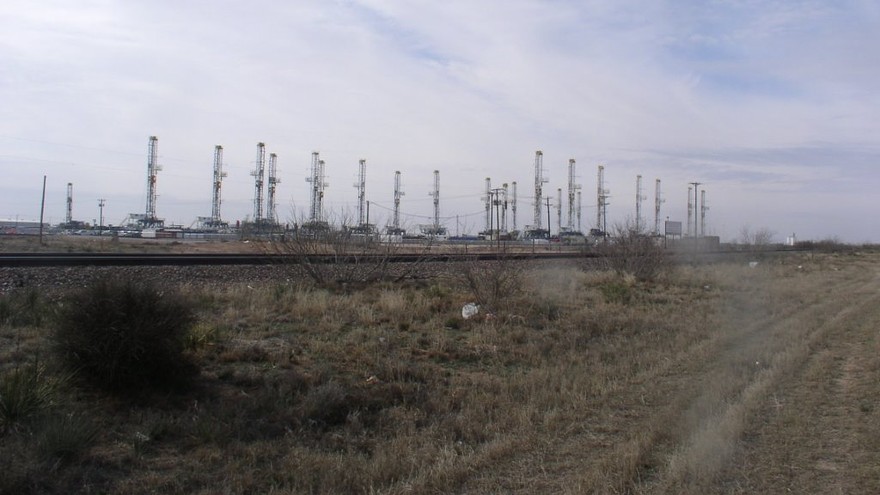
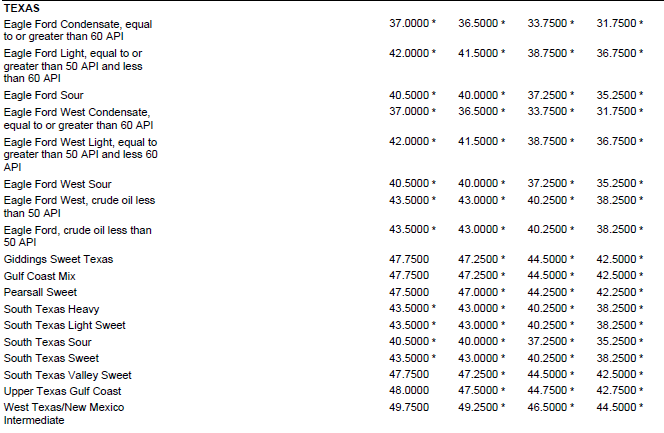
RigData provides another way to look at the market, in Texas (click to enlarge):

Rigdata
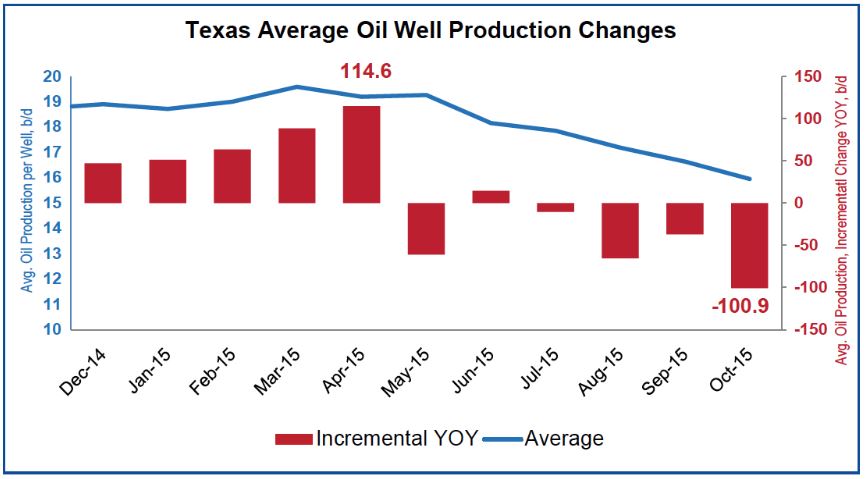
It may come as a surprise to some that the average daily oil production per well in Texas is only 16 barrels. There are a lot of wells in Texas that produce a barrel a day or less. The change in average daily oil production per well is a way to gauge the health of the industry. In Mary 2015, Texas average production per well reached a height of 19.6 bbl/day. Between October 2014 and October 2015, Texas oil production declined by 343,00 bbl/day, from 3.3 million to 2.9 million – a decline of 2.2 bbl/day/well.

Published on:

Oil prices are much in the news, especially in Texas. As oil prices continue to decline, the effect on Texas’ economy is settling in. And with all the talk of oil prices, OPEC is again the focus of much news coverage. What will OPEC do? How much does OPEC really control oil prices? What effect are the low prices having in the OPEC countries themselves?

Here are some interesting websites about OPEC:

OPEC’s own website. It publishes a monthly report, available online, in English.

Published on:

These two graphics from the Energy Information Administration (click to enlarge):

The first shows increased re-fracking of existing wells, and reduction in time needed to drill a horizontal well:

re-fracking-e1447693875835
The second shows how production has held up, despite decreased drilling activity:

Published on:

Last week, the US Energy Information Administration provided a summary of states’ severance tax revenue (click on image below to enlarge):

main
With the precipitous decline in oil prices, Alaska, North Dakota and Wyoming will be hurting.

According to EIA, Texas

Published on:

The Energy Information Administration shows oil production from the Niobrara, Eagle Ford and Bakken fields dropping for the first time, by 24,023 bbl/d — much sooner than some predicted. Production from the Permian Basin is still rising. Operators may be delaying completion of wells already drilled, in effect storing their reserves in the ground. (Click image below to enlarge.)


EIA production graph

Published on:

Here are Flint Hills postings for Texas for January 1, 2, 5 and 6:

download
Eagle Ford West Light Crude has dropped from $42/bbl on January 1 to $36.75/bbl yesterday. Amazing.

View all Flint Hills postings here:  http://www.fhr.com/refining/bulletins.aspx

Contact Information