These two graphics from the Energy Information Administration (click to enlarge):
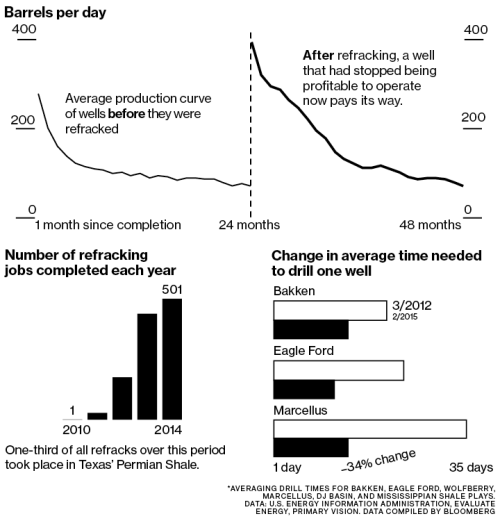
The first shows increased re-fracking of existing wells, and reduction in time needed to drill a horizontal well:
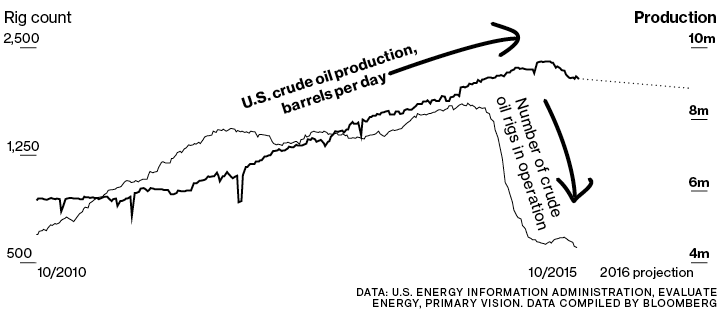
The second shows how production has held up, despite decreased drilling activity: