Articles Posted in Gas market

Published on:

A great article appears in the March Section Report of the Oil, Gas and Energy Resources Law section report, by Jacqueline Weaver, Professor Emeritus, University of Houston Law Center: “The Railroad Commission’s New Duties to Keep Texans Warm: Winter Storm Uri Forces Change.” Here are some excerpts:

The throughput of dry gas production from Permian Basin processing plants dropped 85% from early February to February 18, [2021] and two-thirds of the gas processing plants in the Permian Basin had outages. The natural gas industry blamed electricity suppliers for cutting off power to them when they most needed it; power generators blamed the gas industry for failing to supply gas to them. Many natural gas providers had not filed a short form with ERCOT, the grid operator for most of Texas, that would have exempted them from electric outages during emergencies. The Railroad commission seemed unaware of this form and exemption process. Clearly, the natural gas and electricity sectors needed to communicate and coordinate more closely. In the ERCOT system, natural gas provides about half of all electricity generation.

According to an FERC-NERC Staff Report on Storm Uri:

Published on:

Abbott said the legislature’s response to the breakdown of Texas’ electric grid “fixed all the flaws.” News media reports and experts are questioning that conclusion.

A UT Austin study concludes that lawmakers did not do enough to prevent future power failures and recommended 20 additional policy changes. It is estimated that as many as 700 people died from the freeze.

At least part of the blame lies with the Legislature’s deregulation of the state’s power sector in 1995 that was supposed to save ratepayers money. According to a Wall Street Journal analysis, customers in deregulated areas have paid a surcharge of $28 billion over the last two decades, whereas customers in areas that remain regulated–including El Paso Electric, Austin Energy and CPS Energy in San Antonio–enjoy cheaper electric rates than those in deregulated areas.

Published on:

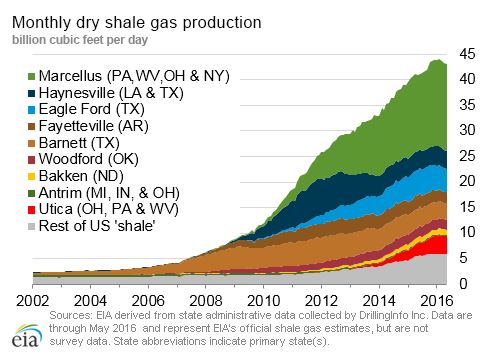
Arthur Berman, a geological consultant, has once again blasted the economics of gas shale plays — this time the Marcellus.  At the annual conference sponsored by the Association for the Study of Peak Oil & Gas – USA, held on October 7-9 in Washington, D.C., Mr. Berman made a presentation: “Shale Gas–Abundance or Mirage? Why the Marcellus Shale Will Disappoint Expectations.”  His power-point from that presentation may be found here:  Arthur Berman on Marcellus.pdf  Mr. Berman argues that only a small percentage of the areas now being touted as productive in shale plays — the “core areas” are economic at any price; that even within the core areas, performance is not uniform and the geology is complex; that the wells are very expensive and the break-even gas price is as high as $8-$12/mcf; that reserves have been overstated by the companies in the plays; that the industry is not properly estimating estimated ultimate recoveries from the wells; that changes in reporting rules recently adopted by the Securities and Exchange Commission allow companies to “book” estimated reserves prematurely; and that the economies of the plays will ultimately be reflected in lower share prices of the companies participating in the plays. 

For the Marcellus in particular, Mr. Berman asserts that infrastructure limitations — lack of pipeline and gas processing capacity — will slow development, that environmental issues — fears about groundwater contamination, proximity to urban areas, and regulatory restraints — will not go away, and that economics for drilling in the Marcellus Shale are no better than in the Barnett Shale. Mr. Berman says that shale gas is the nation’s next speculative bubble likely to burst.

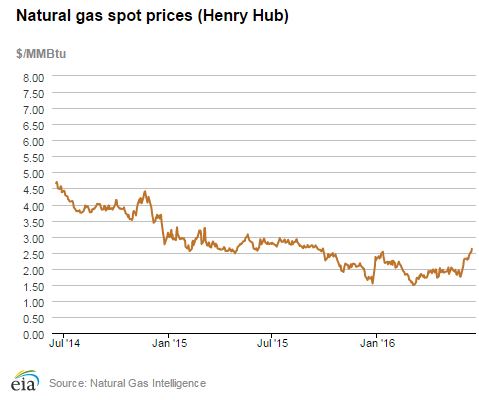
Mr. Berman created a stir just a year ago when he published a similar gloomy analysis of the Barnett Shale, at the ASPO conference in October 2009.  At that time he was a contributor to a trade publication called World Oil, which is sent free to top oil & gas E&P executives. In early November 2009, World Oil was about to publish another article by Mr. Berman critical of shale plays, but the president of the publication ordered that it not be published. Mr. Berman resigned, and his editor Perry Fischer, who insisted that the article be published, was fired. All of this created a stir in the blogosphere. Fischer contended that World Oil executives were pressured by CEOs of two public E&P companies not to publish any more of Mr. Berman’s critiques. Tudor Holt & Pickering, who analyze the oil and gas industry, published a critique of Mr. Berman’s analysis, and two oil executives from Devon and Chesapeake wrote newspaper op ed pieces critical of his work. Chesapeake CEO Aubrey McClendon said at the time that he expected gas prices to continue to rise, which would lead to an increase in drilling and production in the shale plays. “We think all of the elements are in place for gas prices to be higher in 2010 than they are today,” McClendon said.

Published on:

The Wall Street Journal reported today that the Energy Information Administration will revise the way it estimates U.S. natural gas supplies, after concluding that its current method significantly over-estimates supply. An analysis has concluded that there are discrepancies of as much as 12% between the total gas supply (gas produced or imported) and gas demand (gas consumed or stored). In December, the EIA reported gas supply at 87.8 bcf/day and total demand of 80 bcf/day. The high estimates for supply may have unnecessarily depressed prices.

The EIA requires the nation’s largest producers to file a monthly report, Form 914, to report production; based on that report and its models, EIA estimates production by smaller producers. EIA has been less able to account for smaller companies’ production, and it is believed that this is in part a result of shale development and other advances in technology.

Published on:

The information below is from the Energy Information Administration.  Note the wide variation in City Gate and Wellhead Prices among different states:

Gas Prices table.jpg
 

Below is the same information in graph form.  Why would average residential gas prices in Texas be $12.88 per mcf, while residential prices in California and Minnesota — far from natural gas production — be less than $10 per mcf? Why such variations in Residential prices?


EIA Natural Gas Prices graph.jpg

Published on:

Gas prices in Texas recently dipped below $2/mmbtu. Companies are shutting in wells to avoid selling at such low prices. Nevertheless, record volumes of gas are going into storage.

natural-gas-in-storage.gif


The chart shows the five-year monthly average of gas in storage for the last five years, and the red line shows gas in storage this year. Gas in storage for August is already well above the last five-years’ highest volume, and is sure to climb higher. We are likely to find out the true limit of how much capacity there is for gas storage in the U.S. Unless we have a very cold winter, this excess gas may continue to suppress gas prices for months to come.

Published on:

Items from this week:

Prices:  Natural gas prices continue to decline. Below is a comparison of gas NYMEX futures prices with S&P 500 for the last year:

Gas Price Chart.JPG


On August 14, futures for September delivery settled at $3.24/MMBtu, a 52-week low.  Futures prices have declined about 65% from this time a year ago. The Energy Information Administration reports that gas in storage increased by 63 Bcf to 3.152 Tcf for the week ended August 7, compared to 2.65 Tcf a year ago, and well above the five-year average of 2.635 Bcf. Absent severe supply disruptions or a very cold winter, gas prices are likely to remain low for some time.


The price decline has resulted in a corresponding decline in lease and drilling activity. The chart below shows the number of oil and gas leases filed of record in Tarrant County, the center of Barnett Shale activity:

Barnett Shale Leases.JPG

This shows a decline in leasing from 18,000 leases in May, 2008, the height of the leasing frenzy, to 2,000 in July 2009.


Earthquakes:  Scientists from Southern Methodist University have tentatively concluded that recent earthquakes in the vicinity of Dallas-Fort Worth Airport may have been caused by a salt water disposal well located at the southern end of the airport, operated by Chesapeake.


Continue reading →

Published on:

Below is an interesting chart published by the U.S. Energy and Informaton Administration, showing how the U.S. used energy in the U.S. in 2007:

U.S. Primary Energy consumption by source and sector 2007.jpg

The sources of energy are on the left, the sectors of the economy that consume energy are on the right. The lines connecting supply sources and demand sectors show which sectors use which sources of energy. For example, petroleum represents 39.8% of the total supply of energy in the U.S. Seventy percent of that petroleum is used for transportation. Petroleum is the source of 96% of all sources of energy for the transportation sector. The transportation sector consumes 29% of all energy consumed in the U.S.

The chart reveals how natural gas is used in the U.S.: 34% in the industrial sector, 34% in the residential and commercial sector (as fuel to heat and cool homes and buildings), 30% to generate electricity. Most electricity is used by residential and commercial buildings, so in reality electricity is an intermediate demand sector. If it is eliminated as a demand sector, 61% of total demand would show as consumed by residential and commercial buildings. Natural gas would supply 14.8% of total energy used in residential and commercial buildings, either directly for heating and cooling or indirectly through its use to generate electricity. 

Published on:

The Energy Information Administration has revised its forecast for 2009 U.S. industrial natural gas demand, to decline by 7.4% this year. It predicts total natural gas consumption to fall 1.8% in 2009. U.S. natural gas production is expected to decline 0.3% in 2009, and to slip 1% in 2010. EIA predicts natural gas Henry Hub prices to average $4.24/mcf in 2009 and $5.83/mcf in 2010, compared with $9.13/mcf in 2008.

Chesapeake Energy has elected to further curtail its gas production, by a total of 400 mmcf in 2009, representing approximately 13% of Chesapeake’s production capacity.

One petroleum geologist and industry consultant, Arthur Berman, believes that the Haynesville Shale in Lousiana, touted as the hottest onshore gas play in North America, is overrated. His analysis of early discoveries shows that the wells decline rapidly, cost about $7.5 million per well to drill and complete, and would require a price of $8/mcf to break even.  http://petroleumtruthreport.blogspot.com 

Contact Information