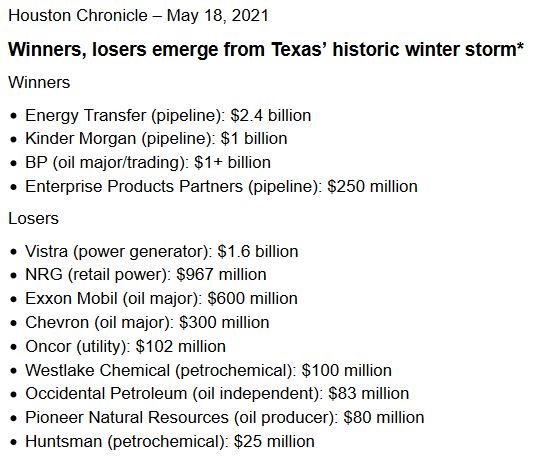
Recently in Energy markets Category

April 29, 2013

Decoupling Oil and Gas

A recent editorial in the Houston Chronicle makes a good point: we should no longer think of "oil and gas" together. Their paths have diverged, at least in the US.

The prices of oil and gas used to be roughly equivalent, based on their energy value - their Btu content. But since the shale revolution in the US, this is no longer the case. Today, gas is much cheaper than oil on an energy-equivalent basis. Today, most exploration companies have moved from gas shale plays to oil shale plays, chasing the higher oil price. But gas prices have recently risen, and wells are still being drilled profitably in the Marcellus. If gas returns to $5-6/mcf, shale gas plays will return, and gas will still be much cheaper than oil.

Second, gas is a clean-buring fuel, unlike oil or coal. US emissions of greenhouse gases have declined substantially since utilities have gradually switched from coal to gas. Vehicles powered by gas have much lower emissions than those fueled by gasoline. Gas is touted as a "bridge fuel" in the transition from hydrocarbon to renewable sources of energy, because of its lighter environmental footprint.

So why are we still using so much oil? Principally because of the transportation sector. It is expensive to convert vehicles to burn natural gas, and there is a dearth of refueling stations in the US for natural gas. If the price of natural gas remains cheap, more and more vehicles will burn it instead of gasoline.

As the public begins to better understand the differences between oil and natural gas, and as the market's confidence grows in the US supply of gas, the stability of its relatively low price, and its more benign environmental impact, gas should make inroads into the transportation industry.

January 10, 2013

Two Interesting Graphs from EIA


 The Energy Information Administration continues to produce fascinating graphs. Two recent ones are below.

 Natural gas hammered coal last year. Low natural gas prices still made electricity cheap. West Texas Intermediate Crude declined, while Brent crude increased.

graph of select commodity futures price changes, as described in the article text


Electricity generated from natural gas equaled that generated from coal for the first time in April 2012:

graph of monthly U.S. electricity generation by fuel, as described in the article text

October 29, 2012

"Energy Independence"?

We're in the crazy election season once again, and once again all candidates have promised "energy independence." Newt Gingrich promised to lower gasoline prices. President Obama takes credit for low natural gas prices. Governor Romney says we can eliminate imports of crude oil. Presidential candidates have promised energy independence ever since the oil embargo in Jimmy Carter's administration. The candidates know that, in fact, government policies have little to do with energy prices, and there is little they can do to influence those prices. It might be good to look at a little history.

First, natural gas prices are still essentially a domestic phenomenon. Although transportation of liquefied natural gas is beginning, it is still very expensive in comparison to domestic prices. And natural gas prices are still essentially a matter of domestic supply and demand. Consider these graphs:

U.S. Gas Production Graph.jpg

NG Wellhead Price Graph.jpg


Prices for natural gas spiked in the last decade; production increased; and prices declined. Supply and demand.

Unlike natural gas, crude oil is a world market, governed by world supply and demand.

U.S. Crude Production Graph.jpg

U.C. Crude Imports.jpg

World Crude Price Graph.jpg


World oil prices climbed over the last decade to reach $100/bbl at the beginning of this decade, and have remained high; U.S. production of oil increased, and U.S. imports declined. Yet prices remain high, due to global demand.

Texas has prospered as a result, increasing its crude production for the first time in decades, largely as a result of unconventional plays, principally the Eagle Ford:

Texas Crude Production Graph.jpg 

Let's hope that some sanity will return to politics and energy policy after the crazy season.


September 27, 2012

Two Interesting Graphs from EIA

As readers may know, I love graphs, and the Energy Information Administration is good at making them. Here are two particularly interesting ones.

China Energy Consumption.jpg


Iraqi production.jpg


May 23, 2012

MIT Study of Relationship Between Oil and Gas Prices

One of the remarkable aspects of the oil and gas markets over the last few years has been the rapid decline of natural gas prices despite the continuing high price of crude oil. Historically, analysists have assumed that there is a relationship between the price of the two commodities. After all, both are basically sources of stored energy, which can be measured in British Thermal Units, or Btus.  One barrel of crude oil has about the same energy as six million Btu of natural gas, so it has been assumed that one barrel of crude should have about the same value as six MMBtu of gas.  When companies report their reserves, they often use the term BOE, or "barrels of oil equivalent," meaning that they convert their gas reserves to oil barrels using this 6-to-1 ratio.  But at today's prices, the ratio on a Btu basis is closer to 12-to-1; it has been as low as 2.5-to-1 and as high as 19-to-1. So why is there now such a de-coupling of oil and gas prices? 

I recently ran across a paper published by two MIT professors titled "The Weak Tie Between Natural Gas and Oil Prices," by David J. Ramberg and John E. Parsons. You can find it here. The authors ask the question: Is there a relationship between the price of oil and the price of natural gas? If there was formerly such a relationship, has it been broken? They use historical data and analysis to answer these questions. Their conclusion:

despite large temporary deviations, natural gas prices continue to exhibit evidence of a cointegrating relationship with crude oil prices, and gas prices consistently return to a long-run relationship. However, this relationship has apparently shifted at least once over a 12-year period to a new equilibrium. There is no statistical evidence to support the claim that a relationship between the two price series has been completely severed.

However, the authors also point out that "there is an enormous amount of unexplained volatility in natural gas prices. The raw price serices for natural gas ... is approximately twice as volatile as the raw oil price series. And the relationship between oil and gas prices "does not appear to be stable through time. ... In the 1989 to 2005 period, the price of natural gas seemed to be shifting up compared to the price of oil, but in recent years this reversed."

The authors analyze the effect on natural gas prices of seasonality -- heat and cold waves and supply disruptions from hurricanes -- and the relationship between gas prices and the amount of natural gas in storage. After taking these effects into account, there is still a large unexplained volatility in natural gas prices.

Nevertheless, the authors say that their analysis shows that "when the natural gas price has been pulled away from the fundamental tie, it will predictably drift back towards it." Producers with large natural gas reserves are hoping the authors are correct.


January 26, 2012

EIA Annual Energy Outlook 2012

The Energy Information Administration has issued its annual energy projections.

Highlights:

Domestic crude oil production is expected to grow by more than 20 percent over the coming decade: Domestic crude oil production increased from 5.1 million barrels per day in 2007 to 5.5 million barrels per day in 2010. Over the next 10 years, continued development of tight oil combined with the development of offshore Gulf of Mexico resources are projected to push domestic crude oil production to 6.7 million barrels per day in 2020, a level not seen since 1994.

With modest economic growth, increased efficiency, growing domestic production, and continued adoption of nonpetroleum liquids, net petroleum imports make up a smaller share of total liquids consumption: U.S. dependence on imported petroleum liquids declines in the AEO2012 Reference case, primarily as a result of growth in domestic oil production of over 1 million barrels per day by 2020, an increase in biofuel use of over 1 million barrels per day crude oil equivalent by 2024, and modest growth in transportation sector demand through 2035. Net petroleum imports as a share of total U.S. liquid fuels consumed drop from 49 percent in 2010 to 38 percent in 2020 and 36 percent in 2035 in AEO2012.

U.S. production of natural gas is expected to exceed consumption early in the next decade: The United States is projected to become a net exporter of liquefied natural gas (LNG) in 2016, a net pipeline exporter in 2025, and an overall net exporter of natural gas in 2021. The outlook reflects increased use of LNG in markets outside of North America, strong domestic natural gas production, reduced pipeline imports and increased pipeline exports, and relatively low natural gas prices in the United States compared to other global markets.

Use of renewable fuels and natural gas for electric power generation rises: The natural gas share of electric power generation increases from 24 percent in 2010 to 27 percent in 2035, and the renewables share grows from 10 percent to 16 percent over the same period. In recent years, the U.S. electric power sector's historical reliance on coal-fired power plants has begun to decline. Over the next 25 years, the projected coal share of overall electricity generation falls to 39 percent, well below the 49-percent share seen as recently as 2007, because of slow growth in electricity demand, continued competition from natural gas and renewable plants, and the need to comply with new environmental regulations.

Total U.S. energy-related carbon dioxide (CO2) emissions remain below their 2005 level through 2035: Energy-related CO2 emissions grow by 3 percent from 2010 to 2035, reaching 5,806 million metric tons in 2035. They are more than 7 percent below their 2005 level in 2020 and do not return to the 2005 level of 5,996 million metric tons by the end of the projection period. Emissions per capita fall by an average of 1 percent per year from 2005 to 2035, as growth in demand for transportation fuels is moderated by higher energy prices and Federal fuel economy standards. Proposed fuel economy standards covering model years 2017 through 2025 that are not included in the Reference case would further reduce projected energy use and emissions. Electricity-related emissions are tempered by appliance and lighting efficiency standards, State renewable portfolio standard requirements, competitive natural gas prices that dampen coal use by electric generators, and implementation of the Cross-State Air Pollution Rule.

http://www.eia.gov/forecasts/aeo/er/  

January 25, 2012

Gas Price Drop In the News

Natural Gas Glut.jpg

Natural gas prices are much in the news. Prices have fallen precipitously in the past few weeks. Natural gas futures have fallen 35% in the past year. Warm weather this winter has created a gas glut. In his state of the union address, President Obama said the US now has 100 years of natural gas supply and touted gas as the energy future. Analysts are predicting that prices will continue to fall. Predictions are that natural gas storage capacity will be tested this year.

http://www.usatoday.com/money/industries/energy/story/2012-01-16/low-natural-gas-prices/52592508/1

http://finance.yahoo.com/news/natural-gas-prices-fall-further-183315966.html  


Fallout from lower gas prices:

Exploration companies are moving to oil plays and drilling only those gas wells necessary to hold acreage. In many plays, such as the liquids-rich portion of the Eagle Ford, lots of gas is being flared in order to get the liquids to market. That gas will eventually go on line, further increasing supply. Producers in some areas can give the gas away and still make money on the liquids. In the Barnett Shale, gas production continues to increase despite the decline in drilling rigs. Barnett shale production set an all-time high of 5.9 Bcf/day in October 2011, with 2/3rds less drilling activity.

http://www.eenews.net/public/Greenwire/2012/01/20/4  

Chesapeake, the nation's second-largest gas producer, recently announced that it is shutting in as much as one Bcf/d of its production - about 16% of its total -- until prices improve.

http://af.reuters.com/article/energyOilNews/idAFL2E8CNATD20120123?pageNumber=2&virtualBrandChannel=0  

Most analysts are revising their price predictions down. But Anadarko predicts that natural gas prices will rise as soon as drilling slows.

http://www.platts.com/RSSFeedDetailedNews/RSSFeed/NaturalGas/3901910  

Electricity prices are falling - good for consumers, not so good for power producers. Prices of fertilizer and plastics are also falling. More electric power plants are switching from coal to gas, and coal plants on the drawing board are being reconsidered. Over the past decade, electricity from gas-fired plants has increased by 50 percent, while coal-fired electric generation has declined. Gas-fired power plants are cheaper to build and easier to get permitted. They are also easier to turn on and off, as electricity demand fluctuates. The power industry is beginning to have some confidence in the domestic gas supply. Export of excess supplies of U.S. natural gas are being discussed and planned.

http://fuelfix.com/blog/2012/01/16/electric-plants-shift-from-coal-to-natural-gas/  

Low gas prices have dampened enthusiasm for nuclear power plants and generation from wind and solar. The cost, including construction, to generate one megawatt hour of gas-fueled electricity is now less than that for coal, wind and solar, according to Bloomberg.

http://www.bloomberg.com/news/2012-01-17/electricity-declines-50-in-u-s-as-shale-brings-natural-gas-glut-energy.html  

But Energy Secretary Steven Chu says that the alternative energy industry can benefit from low gas prices. Because of gas generating plants' ability to "swing" in output, it should be easier for wind and solar generation to sell into the market when they are able to provide generating capacity.

http://www.cleveland.com/business/index.ssf/2012/01/doe_boss_says_shale_gas_could.html  

Cheap gas has caused owners of a methanol plant in Chile to consider moving a methanol plant to Louisiana. Natural gas is the feedstock for methanol.

http://www.sfgate.com/cgi-bin/article.cgi?f=/g/a/2012/01/18/bloomberg_articlesLY00LK6S972H01-LY0LC.DTL#ixzz1juRrY5NE  

To take advantage of low gas prices, the Texas Commission on Environmental Quality is offering $4.5 million in grants to build natural gas fueling stations, to encourage use of natural gas in the transportation sector.

http://www.tceq.texas.gov/news/releases/1-12CTT1-18

Meanwhile, the debate over the safety of hydraulic fracturing continues. One report says that state agencies who have traditionally regulated the oil and gas exploration industry are tightening their regulations to avoid a takeover of their responsibilities by the EPA.

http://energy.aol.com/2012/01/18/states-toughen-fracking-rules-ahead-of-epa/  

And, the debate continues (at least in Ithaca NY) over whether burning natural gas in fact has less of a global warming impact than coal.

http://online.wsj.com/article/AP5a65cb4fae304d60ba49904e3053e259.html  


June 29, 2011

New York Times Articles on Shale Plays Create a Stir

Two recent articles by a New York Times reporter, Ian Urbina, have caused strong reactions among the industry and those following shale plays in the U.S. Urbina's articles may be found here and here. Urbina's basic theme is that the new reserves of natural gas attributed to shale plays are not real, but are a "Ponzi scheme" created by overestimates of reserves by companies desiring to pump up their stock prices. Urbina bases his conclusions on emails from different industry players and analysts, including the Energy Information Administration, PNC Wealth Management and IHS Drilling Data, and anonymous sources in the industry, including Chesapeake and Enron. Links to these emails are in the articles. Many of them date back to 2009. "In the e-mails, energy executives, industry lawyers, state geologists and market analysts voice skepticism about lofty forecasts and question whether companies are intentionally, and even illegally, overstating the productivity of their wells and the size of their reserves. Many of these e-mails also suggest a view that is in stark contrast to more bullish public comments made by the industry, in much the same way that insiders have raised doubts about previous financial bubbles," says Urbina.

Urbina's articles have provoked strong responses.

  • ExxonMobil responded with a post on its "Perspective" blog page:   

"It is unfortunate that the words "rigorous" and "methodical" can't be applied to the New York Times' recent articles. Understanding the facts surrounding the potential for development of our nation's energy resources is every American's business.  Our economic recovery, environmental progress and energy security depends in part on a sound, stable and sensible policy and regulatory framework informed by honest, fact-filled debate.  The Times' current campaign undermines this debate and is a disservice to its readers."

  • The Energy Information Administration issued a press release defending its estimates of shale gas reserves.


  • Chesapeake weighed in with its criticism of the NYT articles:

"The Times story was obviously motivated by an anti-natural gas agenda. It is telling that the reporter chose not to interview a single reliable source and instead selectively quoted emails from unnamed sources or well-known industry critics dating back to as early as 2007 to invent a series of inaccurate and misleading allegations. If the Times was interested in reporting the facts and advancing the debate about the prospective benefits of natural gas usage to energy consumers, it could easily have contacted respected independent reservoir evaluation and consulting firms that annually provide reserve certifications to the U.S. Securities and Exchange Commission or contacted experts at the U.S. Energy Information Administration, the Colorado School of Mines' Potential Gas Committee, the Massachusetts Institute of Technology, Navigant Consulting and others who would gladly have gone on record to confirm the abundant resources that have been made available thanks to the horizontal drilling and hydraulic fracturing techniques that Chesapeake and other industry peers have pioneered in deep shale formations across the U.S."

  • IHS CERA responded to the Times that
"Emails referenced in the article were written in 2008 and 2009, early in the understanding of the performance metrics for shale gas and have been proven completely wrong by events. One of the emails that was referenced in the article as from IHS was apparently written by someone misidentified as an IHS employee when in fact that person had not been employed by IHS for more than a year.


"Unconventional technologies and resources have moved with great speed. There is much more information about the performance and potential of shale resources available today than in the past. Shale gas supplies have built up very rapidly and now are 25 percent of total U.S. gas supply, as costs have come down dramatically and experience and knowledge have progressed.


"In February 2009, the IHS CERA report, "The Shale Gale," stated that the "recent revolution in the production of unconventional shale gas" would result in "a substantial increase in shale production and reserves"' and "a rapid growth of shale gas supply."  Also in February 2009, IHS CERA's study Rising to the Challenge said: "Unconventional gas will drive growth."  


"That was the IHS position then and it continues to be our position today.  Both of these reports were released well before the 2009 email cited in the NY Times story."
 
  • ProPublica published its own article alleging that the SEC revised its rules on how reserves are calculated, allowing companies to greatly increase their reserve estimates, relying heavily on the Times articles and research.


  • Forbes Magazine published a blog post calling the Times "all hot air on shale gas." 

The best and most thoughtful response to the Times articles is from this post by Michael Levi of the Council on Foreign Relations: "I can't say that I've read through all of the hundreds of pages of documents that the Times has posted on its site. But I've gone through a good enough slice of them (including all the emails that the Times references in its articles) to get a feel for how Urbina went about using them in his stories. There's a pattern: Urbina was clearly looking for negative views of shale gas, and had no problem finding them." Levi goes on to write that Urbina did raise some significant issues about how shale gas reserves should be assessed, but he did so without really understanding the economics of the E&P industry.

This is not the first criticism of industry estimates of shale gas reserves. In 2009, Arthur Berman, a geologist and then consultant with World Oil, published a gloomy analysis of Barnett Shale economics and reserves in 2009. See my earlier post about Berman here.

May 7, 2010

News of "Super Extended Laterals" in Woodford Shale, and ConocoPhillips' First Well in Eagle Ford Shale

Newfield Exploration has reported that it is drilling horizontal wells with "super extended laterals" in the Woodford Shale in Oklahoma -- wells with laterals exceeding 5,000 feet. Newfield has so far drilled 14 super-extended lateral wells, with an average length of 9,000 feet. Those wells had an average gross initial production rate of approximately 9 MMcfe/day.

ConocoPhillips reported that it has completed the drilling of four horizontal wells in the Eagle Ford shale play, in its "liquids-rich" core. The first of these wells was put on production in March and flowed at an initial rate of 3.8 mmcf/day and 1,200 barrels/day of condensate.

All of the new shale gas production continues to put downward pressure on gas prices. Natural gas futures for June delivery fell 36.8 cents, or 8.5 percent on Thursday, April 29 on NYMEX. So far this year, natural gas futures have fallen 29 percent. The Energy Information Administration reported that the supply of gas in storage increased  by 83 Bcf for the week ended April 30. Gas in storage is 315 Bcf above the 5-year average.

natural-gas-in-storage.gif

January 15, 2010

Interesting Comparison of Wellhead and Residential Gas Prices Across States

The information below is from the Energy Information Administration.  Note the wide variation in City Gate and Wellhead Prices among different states:

Gas Prices table.jpg  

Below is the same information in graph form.  Why would average residential gas prices in Texas be $12.88 per mcf, while residential prices in California and Minnesota -- far from natural gas production -- be less than $10 per mcf? Why such variations in Residential prices?


EIA Natural Gas Prices graph.jpg

December 15, 2009

International Energy Agency Climate-Change Policy Scenario

The International Energy Agency (IEA) issued a forecast of world energy consumption and use, and for the first time included a scenario projecting the impacts of taking steps to stabilize greenhouse gases in the atmosphere at about 450 parts per million by 2030. This "450 Secnario" would limit overall temperature increases to 2 degrees C., versus a rise in global temperature of as much as 6 degrees if no efforts to curb carbon dioxide are made. The report compares this 450 Scenario to its "reference scenario," its projections of energy production, prices and consumption assuming no policy changes are enacted.

Its conclusions:

Under the reference scenario, oil prices would increase to $87/bbl in 2015, $100/bbl by 2020, and $115/bbl by 2030 (in 2008 dollars). Under the 450 Scenario, the oil price would level off at $90/bbl by 2020.

Natural gas prices would grow 17% by 3020 under the 450 Scenario, or an average of 0.7%/year.  In 2030, gas prices would be 17% lower than under the reference scenario.

Although significant additional investment would be necessary to meet the 450 Scenario, this investment would be more than offset by fuel cost savings. Oil and gas import costs for OECD countries would be much less. Oil and gas import costs for China and India would be 30% lower in China and India in 2030 than in the reference scenario.

June 26, 2009

Lots of Energy Behind Use of Natural Gas as Vehicle Fuel

Momentum appears to be gaining to increase use of compressed natural gas in vehicles in the U.S., both to decrease the nation's dependence on foreign oil and as a "bridge fuel" to fight global warming.

  • Last Week, the Potential Gas Committee issued a report estimating that the toal U.S. natural gas resource base at year-end 2008 was 1,836 trillion cubic feet, an increase of 39% from its 2006 estimate. Most of this increase comes from newly discovered shale reservoirs. Boone Pickens said that the new estimate "is the equivalent of nearly 350 billion barrels of oil, about the same as Saudi Arabia's oil reserves."
  • Boone Pickens' energy plan includes greatly expanding the use of natural gas as fuel for transportation.
  • At current natural gas prices, compressed natural gas is about $1.00 cheaper than gasoline.
  • Natural gas is clean-burning: greenhouse gas emissions are 20 to 22 percent lower than comparable gasoline or diesel vehicles. Natural gas vehicles (NGVs) are the cleanest-emission vehicles now on the road. In tests conducted in metropolitan areas that have been designated by EPA as non-attainment areas for air quality, exhaust from NGVs has sometimes tested cleaner than the ambient air. Natural gas produces about half of the carbon dioxide emissions as coal for the same amount of heating energy.
  • The biggest obstacle to use of NGVs is lack of available refueling stations. The map at the following link shows compressed natural gas fueling stations in the U.S.: http://rpm.nrel.gov/transatlas/launch/ . Most are in California and along the east coast.
  • In the rest of the world, natural gas is a major transportation fuel. In Italy, there are more than 800 CNG stations. In Germany, NGVs are expected to increase to 2 million vehicles by 2020. Worldwide, there are more than seven million NGVs on the roads, with the largest numbers in Argentina, Brazil, Pakistan, Italy, India, China, Thailand and Iran.
  • Many manufacturers make bi-fuel vehicles, capable of burning either gasoline or compressed natural gas. Major manufacturers of NGVs include Fiat, Opel, Peugeot, Volkswagen, Toyota, Honda and others. The Honda Civic GX is the only CNG-powered car currently sold in the U.S, mostly in California. Fiat's expertise in NGVs is expected to be imported into U.S.-made Chrysler vehicles.
  • Aubrey McClendon, CEO of Chesapeake, drives a bi-fuel Chevrolet Tahoe and says that CNG has cost him on average about 95 cents per gallon.
  • Many state and federal incentives are being enacted to encourage construction of NGV fueling stations.  For example, Oklahoma passed a new law that will allow the State to provide a refueling structure for fleet services used by schools, county and municipal governments, and sets up a fund to provide money to state agencies and political subdivisions to lease or buy NGVs.
  • "Compressed Natural Gas" and "Compressed Natural Gas Vehicles" have their own entries in Wikipedia.

So when are you going to by your first NGV?


May 7, 2009

Momentum Increasing for Use of Natural Gas in Vehicles

Boone Pickens' efforts to promote natural gas as an alternative to gasoline in vehicles seems to be gaining momentum. In a column published by the Huffington Post, Pickens said that the recent advances in extraction of natural gas from shales is a "game-changer." "One study estimates that we have enough natural gas to satisfy current demand for the next century."  Pickens reports that H.R. 1835, the NAT GAS Act, has strong bipartisan support in Congress. the NAT GAS Act provides incentives for installation of compressed natural gas (CNG) fueling stations and use of CNG in large trucks and fleet vehicles.

Natural gas gives off 25% less carbon dioxide than oil for the same amount of energy produced. About 1/3 of total U.S. carbon dioxide emissions come from burning of gasoline in internal combustion engines. For a good summary of the use of CNG, go to the U.S. Department of Energy's website on Energy Efficiency and Renewable Energy. 

Although Texas leads the nation in natural gas production, it is behind ten other states in the number of CNG fueling stations.


CNG Stations.JPG Louisiana is considering its own legislation offering incentives to convert existing vehicles to natural gas and the installation of CNG fueling stations. Chrysler's recently announced plan to sell its best assets to Fiat may present a major opportunity to increase sales of natural gas vehicles (NGVs) in the U.S. Fiat plans to sell 120,000 NGVs in Italy this year. Only one NGV passenger car, the Honda Civic GX, is sold in the U.S. and there are only about 130,000 NGVs of all types currently on U.S. roads.
April 24, 2009

Sources and Users of Energy in the U.S.

Below is an interesting chart published by the U.S. Energy and Informaton Administration, showing how the U.S. used energy in the U.S. in 2007:

U.S. Primary Energy consumption by source and sector 2007.jpg

The sources of energy are on the left, the sectors of the economy that consume energy are on the right. The lines connecting supply sources and demand sectors show which sectors use which sources of energy. For example, petroleum represents 39.8% of the total supply of energy in the U.S. Seventy percent of that petroleum is used for transportation. Petroleum is the source of 96% of all sources of energy for the transportation sector. The transportation sector consumes 29% of all energy consumed in the U.S.

The chart reveals how natural gas is used in the U.S.: 34% in the industrial sector, 34% in the residential and commercial sector (as fuel to heat and cool homes and buildings), 30% to generate electricity. Most electricity is used by residential and commercial buildings, so in reality electricity is an intermediate demand sector. If it is eliminated as a demand sector, 61% of total demand would show as consumed by residential and commercial buildings. Natural gas would supply 14.8% of total energy used in residential and commercial buildings, either directly for heating and cooling or indirectly through its use to generate electricity. 

Unlike coal and petroleum, demand for natural gas is spread among three demand sectors -- industrial, residential and commercial, and electric power. Today demand for natural gas is depressed, principally because of increased supply and low demand in the industrial and electric power sectors. If natural gas' share of the transportation sector could be increased by conversion of vehicles to burn it, domestic supplies of natural gas could supplant imported petroleum as a source of supply for the transportation sector. For an excellent article on the use of natural gas as an alternative fuel for transportation, see Seeking Alpha's article.