The news is filled with stories predicting the effect of falling oil prices on US production. Good news for the economy, bad news for the Texas oil and gas industry. Will the rig count fall? Will companies go into bankruptcy? Only time will tell.
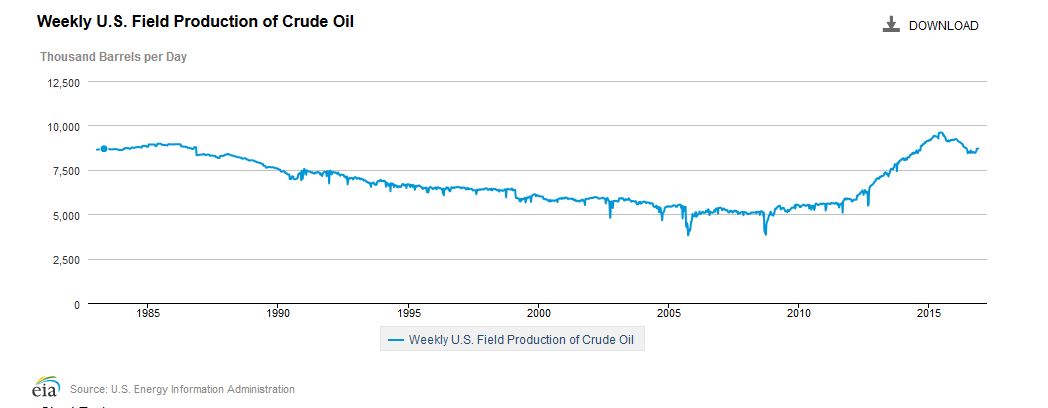
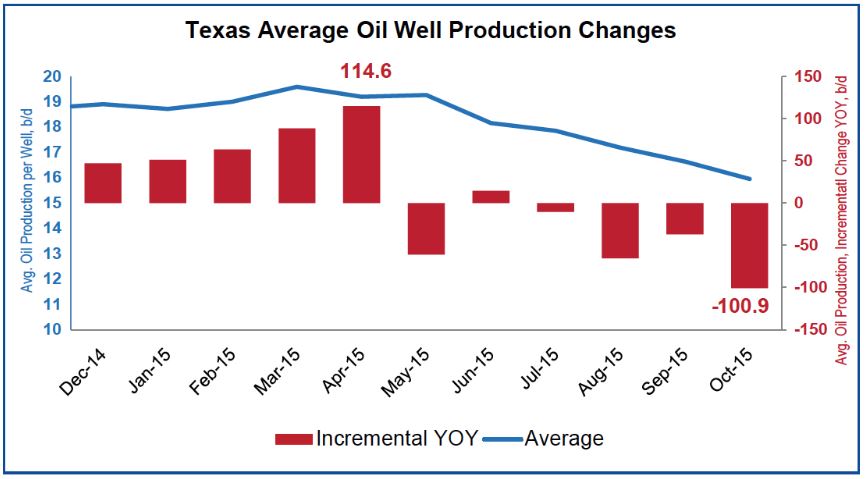
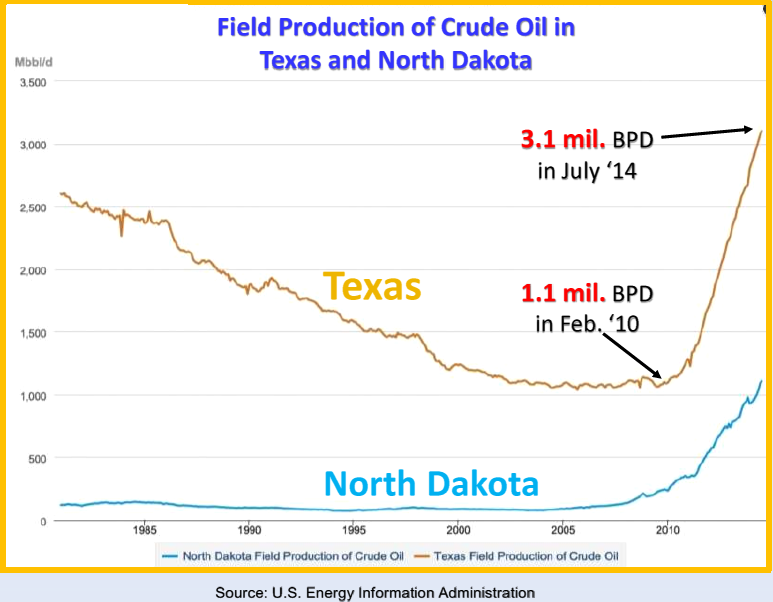
The answer may depend on OPEC. OPEC countries produce about one-third of the world’s total oil each month. OPEC countries have about 80 percent of the world’s oil reserves. Predictions of OPEC’s demise are greatly exaggerated. But US production has increased to almost 9 million barrels a day, close to Saudi Arabia’s production. Texas is responsible for a big part of that increase:
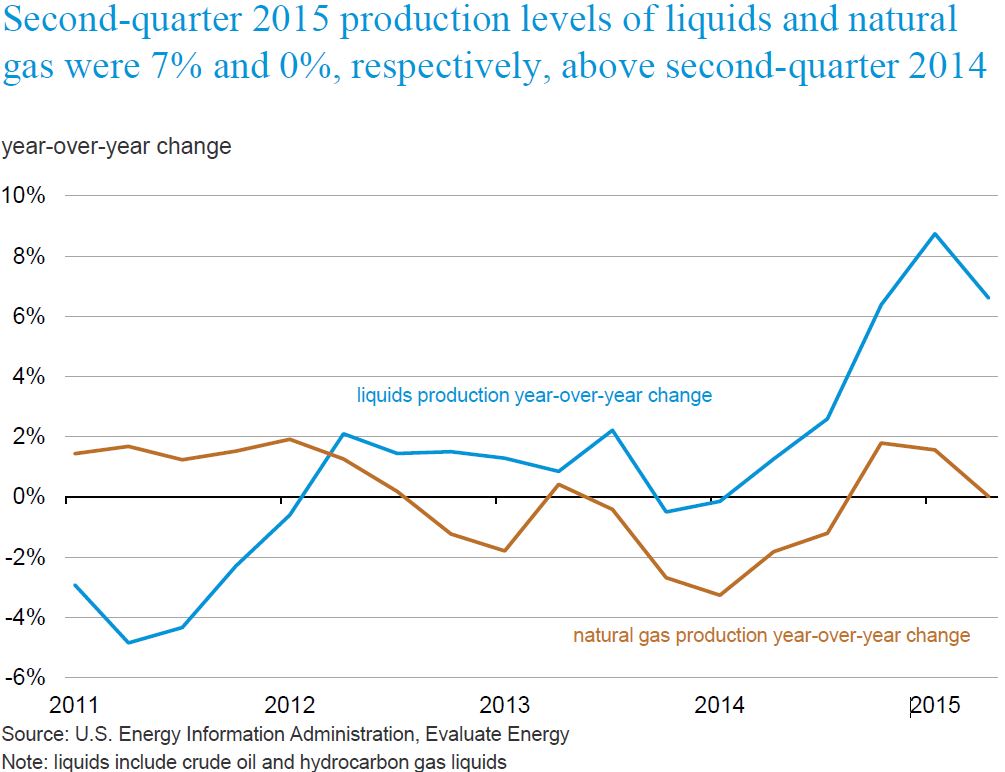
Clearly the increased US production, combined with the predictable decline in demand and the slowdown of China’s and Europe’s economies, is affecting the world oil price. OPEC convenes on November 27, and pundits are guessing what it will do. On October 29, OPEC’s Secretary-General Abdalla El-Badri, cautioned calm, after a conference in London: “We don’t see really fundamental changes in the supply side or the demand side. Unfortunately everyone is panicking. The press is panicking, consumers are panicking. We really should think and see how this will develop.”


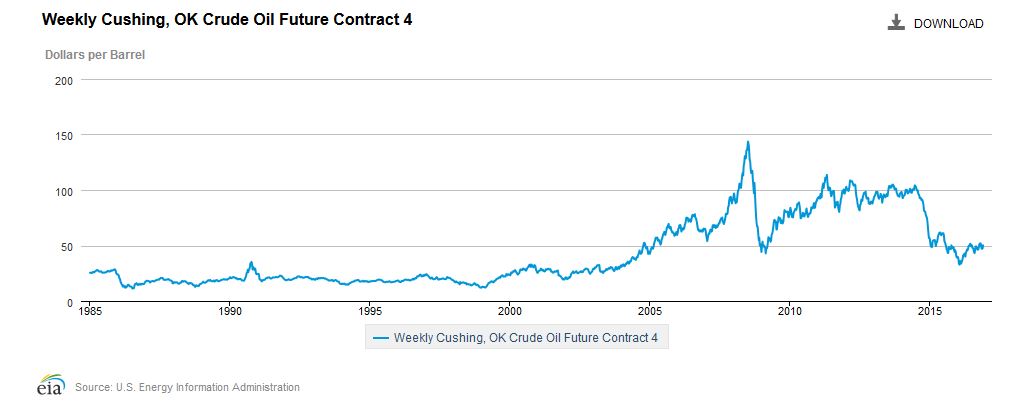
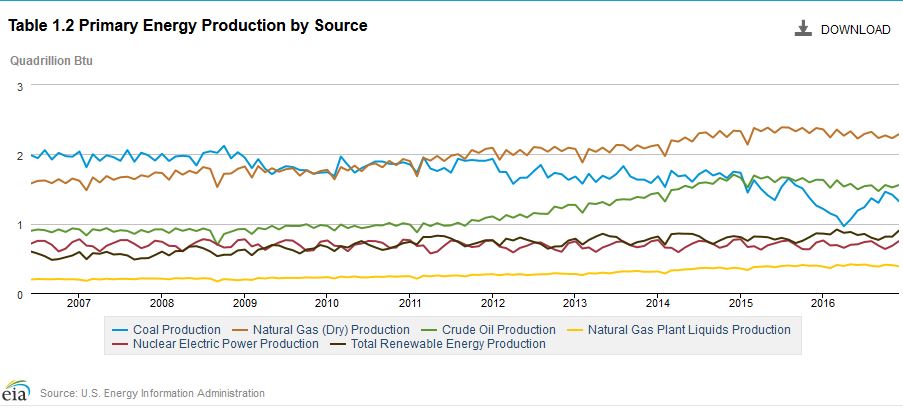 You can revise the graphs to cover any time period. For example:
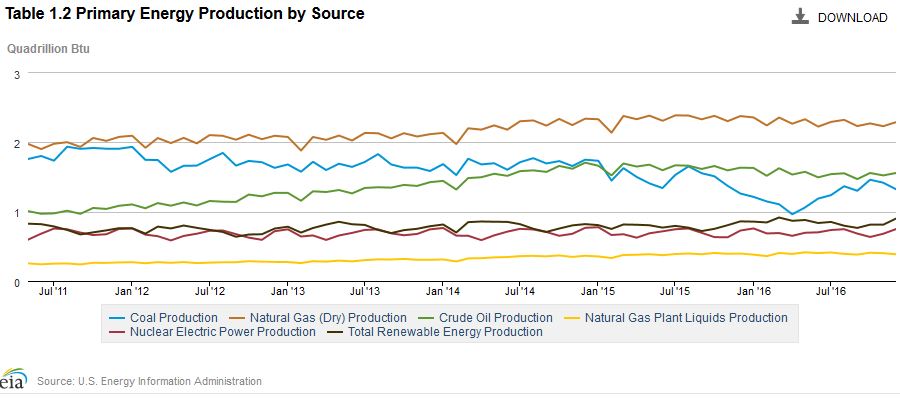 Here’s another interesting one: