Articles Posted in Energy markets

Published on:

To better understand the recent news about the precipitous drop in crude prices, it is helpful to review the global picture of world oil production and consumption. (click on images to enlarge.)

In 2018, the US produced 18% of total world oil production, the most of any country. If Saudi Arabia increases its production by a million barrels a day, that would increase world production by about 1%.

top-world-producers-2018
In 2017, the US consumed 20% of total world oil consumption.

Published on:

Happy New Year.

The decade now ending was the decade of the Permian Basin.  Its rise in production changed the US to a net oil exporter.

Permian-Oil-Production

Permian gas production, a byproduct of the search for oil, drove down gas prices and resulted in a frenzied effort to build pipelines to move the gas to the coast.

Permian-Gas-Production

Continue reading →

Published on:

I ran across an excellent article, “A Primer on the Geopolitics of Oil,” by Anand Toprani, assistant professor of Strategy & Policy at the U.S. Naval War College. He has a book in the works, Oil and the Great Powers: Britain and Germany, 1914-1945.

Oil has been a commodity different from all others in world politics since it became the principal source of energy in the early 20th century. And it will remain so as long as the world is dependent on hydrocarbons for its energy needs. Toprani’s article reminds us how oil supply, demand and price affect our relations with other nations as well as our environment and our personal lives.

Published on:

Morningstar has published a report analyzing oil pipeline and refining capacities along the Texas Gulf Coast – “Pipeline Plans Suggest Tsunami of Crude Exports – Midstream companies looking to double Gulf Coast shipments.”  pipeline-plans-suggest-tsunami-of-crude-exports-FINAL  If all planned pipelines are built and run to capacity, new lines “would carry as much as 7.7 mmb/d of new crude to the Gulf Coast, the majority of which would be light shale crude looking for a home in the export market.”

MorningstarThe result:  a fourfold increase in crude exports to more than 8 mmb/d after 2021.  Morningstar concludes:

Fortunately, current production forecasts don’t match the volume of pipeline projects, and crude growth over the next three years is likely to be closer to 3 mmb/d. The mismatch suggests an infrastructure overbuild is underway in the short term, and we expect consolidation of many of these projects before they’re built. Yet the history of shale expansion has taught us that the most optimistic forecasts frequently appear in the rearview mirror.

Published on:

I love these energy flow diagrams from the Energy Information Administration. Below is the one for total energy sources and uses. EIA has others for crude oil, natural gas, coal and electricity. Click to enlarge.EIA-US-Energy-Flow-2017Here’s the flow chart for natural gas. Note how much US gas comes from shale gas wells and oil wells.

EIA-US-natural-gas-flow-2017

Published on:

An article in the Harvard Business Review, Oil’s Boom-and-Bust Cycle May Be Over. Here’s Whyprovides an excellent overview of how the global oil market has been changed fundamentally by development of shale oil resources.  Excerpts:

  • U.S. shale producers “now represent half of U.S. oil production, up from a mere 10% just seven years ago in 2011. In fact, 2018 may mark the first year shale producers will be able to fund future expansions of drilling programs through their own cash flow.”
  • ” Oil companies will need to develop both new conventional and unconventional crude oil resources to keep up with current demand for roughly one million more barrels of oil every year in addition to replacing the approximately four million barrels lost annually as reservoirs are naturally depleted. In total, we estimate that the oil and gas industry will have to replace about 40% of today’s oil production over the next seven to nine years.”
Published on:

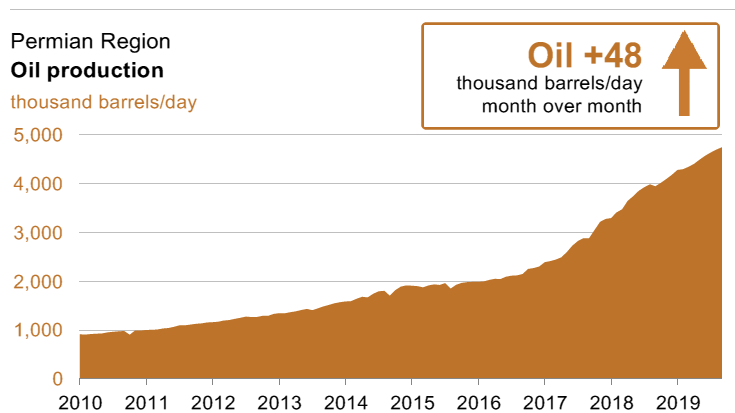
I recently ran across an article on Investing.com“The Problematic Truth About U.S. Shale Oil Production,” by Dr. Ellen Wald, who hosts a podcast about global energy. Dr. Wald reports on her recent podcast discussion with Art Berman, a geology consultant and frequent speaker and author. It reminded me that I wrote about Mr. Berman several years ago, when the shale gas plays in the Marcellus and Barnett were getting started. He told Dr. Wald that the Permian shale plays have much smaller reserves than others — including the Energy Information Administration — have estimated, as little as 3.8 billion barrels.

In 2010, I wrote about Mr. Berman’s attendance at a conference in Washington sponsored by the Association for the Study of Peak Oil & Gas – USA, of which he is a director. At that time he argued that the gas reserves in the Marcellus were much smaller than were being predicted. A year earlier, Mr. Berman created a stir when he published a gloomy analysis of the Barnett Shale. He was then a contributor to World Oil, a trade publication, and World Oil refused to publish one of his articles, causing him and his editor to resign and creating a stir.

Mr. Berman was on a panel hosted by Texas Monthly in 2013, along with Scott Tinker of the UT Bureau of Economic Geology, and Kenneth Medlock, then an energy fellow at the Baker Institute. He continued to question estimates of shale oil and gas reserves.  (Dr. Tinker created a wonderful website for those wanting to know more about world energy, the Switch Energy Project, worth exploring.)

Published on:

I have often received calls from clients who receive unsolicited offers to buy their minerals. In the past, mineral owners have generally ignored these offers, reminded of their grandmother’s admonition to “never sell your minerals.”

That has changed. The buying and selling of minerals has now become common. Investment monies have flowed into funds that acquire mineral interests. Companies have been founded with that objective. Some of the largest mineral portfolios have been assembled by purchase over the last decade. Black Stone Minerals, for example, has evolved from a family-owned East Texas lumber company into one of the largest mineral owners in the country. Energynet, founded in 1999, conducts online auctions of minerals and now handles more than $1 billion per year in transactions.

Investment in minerals, especially in Texas, has several advantages.  Holding costs for minerals are minimal. Taxes are assessed only on producing minerals.  Severed non-producing minerals cannot be adversely possessed.  No liability risks attach to mineral and royalty interests.

Published on:

From OilPrice.com:

Last year, the value of U.S. energy exports to Mexico was US$20.2 billion, while the value of U.S. energy imports from Mexico was only US$8.7 billion, according to the EIA.

On the other hand, Mexico’s oil and gas output is 40 percent off its peak levels, an S&P Global Platts report showed last week. Mexico’s crude oil output of 2 million bpd in June was far below the 2004 peak of 3.4 million bpd, while dry natural gas production is 3.2 Bcf/d this year, compared to a 2010 peak of 5.1 Bcf/d. Mexico, therefore, relies heavily on U.S. pipeline gas and LNG imports.

Published on:

Here’s another great graph explaining US Energy production and consumption, from the Energy Information Administration. It’s called an Energy Flow Diagram. Numbers are in quadrillion BTU’s. Click on image to enlarge:

EIA-total-energy-flow-diagram-2017Consider:

We still import 21.72 QBTU of petroleum, about 22% of our total consumption – about what we consume in residential uses. But we also export 13.86 QBTU.

Contact Information